
Page 276 - Volume 2_CHANGES_merged_with links
P. 276
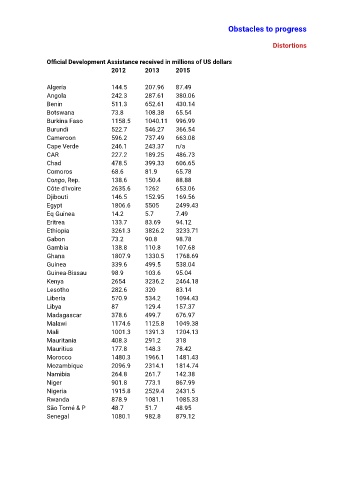
Obstacles to progress


                                                                                                 Distortions


                 Official Development Assistance received in millions of US dollars
                                        2012        2013       2015

                 Algeria                144.5       207.96     87.49
                 Angola                 242.3       287.61     380.06
                 Benin                  511.3       652.61     430.14
                 Botswana               73.8        108.38     65.54
                 Burkina Faso           1158.5      1040.11    996.99
                 Burundi                522.7       546.27     366.54
                 Cameroon               596.2       737.49     663.08
                 Cape Verde             246.1       243.37     n/a
                 CAR                    227.2       189.25     486.73
                 Chad                   478.5       399.33     606.65
                 Comoros                68.6        81.9       65.78
                 Congo, Rep.            138.6       150.4      88.88
                 Côte d'Ivoire          2635.6      1262       653.06
                 Djibouti               146.5       152.95     169.56
                 Egypt                  1806.6      5505       2499.43
                 Eq Guinea              14.2        5.7        7.49
                 Eritrea                133.7       83.69      94.12
                 Ethiopia               3261.3      3826.2     3233.71
                 Gabon                  73.2        90.8       98.78
                 Gambia                 138.8       110.8      107.68
                 Ghana                  1807.9      1330.5     1768.69
                 Guinea                 339.6       499.5      538.04
                 Guinea-Bissau          98.9        103.6      95.04
                 Kenya                  2654        3236.2     2464.18
                 Lesotho                282.6       320        83.14
                 Liberia                570.9       534.2      1094.43
                 Libya                  87          129.4      157.37
                 Madagascar             378.6       499.7      676.97
                 Malawi                 1174.6      1125.8     1049.38
                 Mali                   1001.3      1391.3     1204.13
                 Mauritania             408.3       291.2      318
                 Mauritius              177.8       148.3      78.42
                 Morocco                1480.3      1966.1     1481.43
                 Mozambique             2096.9      2314.1     1814.74
                 Namibia                264.8       261.7      142.38
                 Niger                  901.8       773.1      867.99
                 Nigeria                1915.8      2529.4     2431.5
                 Rwanda                 878.9       1081.1     1085.33
                 São Tomé & P           48.7        51.7       48.95
                 Senegal                1080.1      982.8      879.12