
Page 275 - Volume 2_CHANGES_merged_with links
P. 275
Obstacles to progress
Distortions
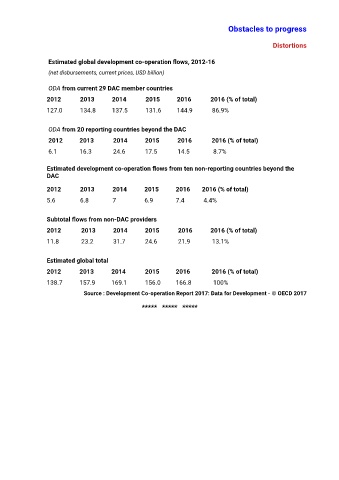
Estimated global development co-operation flows, 2012-16
(net disbursements, current prices, USD billion)
ODA from current 29 DAC member countries
2012 2013 2014 2015 2016 2016 (% of total)
127.0 134.8 137.5 131.6 144.9 86.9%
ODA from 20 reporting countries beyond the DAC
2012 2013 2014 2015 2016 2016 (% of total)
6.1 16.3 24.6 17.5 14.5 8.7%
Estimated development co-operation flows from ten non-reporting countries beyond the
DAC
2012 2013 2014 2015 2016 2016 (% of total)
5.6 6.8 7 6.9 7.4 4.4%
Subtotal flows from non-DAC providers
2012 2013 2014 2015 2016 2016 (% of total)
11.8 23.2 31.7 24.6 21.9 13.1%
Estimated global total
2012 2013 2014 2015 2016 2016 (% of total)
138.7 157.9 169.1 156.0 166.8 100%
Source : Development Co-operation Report 2017: Data for Development - © OECD 2017
***** ***** *****