
Page 68 - Live-cellanalysis handbook
P. 68
Live-Cell Analysis Handbook — Third Edition
1 Seed cells 2 Label test antibody 3 Add to cells 4 Live-cell
fluorescent imaging
Cell Seeding Labeling of Test Antibody with IncuCyte® FabFluor- Automated Imaging and
Seed cells (50 μL/well, IncuCyte® FabFluor-pH Red labeled Antibody Addition Quantitative Analysis
5,000-30,000 cells/well), into Reagent Add antibody-FabFluor mix Capture images every 15-30
96-well plate and leave to Mix antibody and FabFluor (50 μL/well) to cell plate. minutes (10x or 20x) in
adhere (2-24 h, depending on Reagent at a molar ratio of IncuCyte® for 24-48 hours.
cell type). 1:3 in media, 2x final assay Analyze using integrated
concentration. Incubate for 15 software.
minutes to allow conjugation.
Figure 1. Overview of IncuCyte® antibody internalization assay
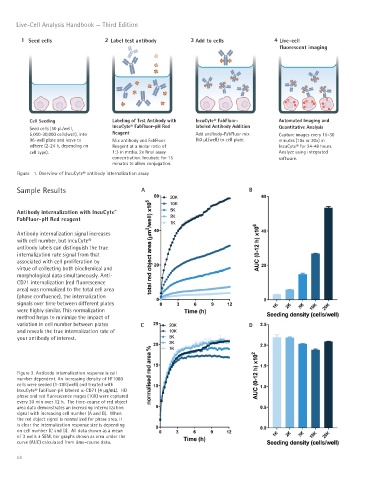
Sample Results A B
Antibody internalization with IncuCyte
®
FabFluor-pH Red reagent
Antibody internalization signal increases
with cell number, but IncuCyte®
antibody labels can distinguish the true
internalization rate signal from that
associated with cell proliferation by
virtue of collecting both biochemical and
morphological data simultaneously. Anti-
CD71 internalization (red fluorescence
area) was normalized to the total cell area
(phase confluence), the internalization
signals over time between different plates
were highly similar. This normalization
method helps to minimize the impact of
variation in cell number between plates C D
and reveals the true internalization rate of
your antibody of interest.
Figure 2. Antibody internalization response is cell
number dependent. An increasing density of HT1080
cells were seeded (1-20K/well) and treated with
IncuCyte® FabFluor-pH labeled a-CD71 (4 μg/mL). HD
phase and red fluorescence mages (10X) were captured
every 30 min over 12 h. The time-course of red object
area data demonstrates an increasing internalization
signal with increasing cell number (A and B). When
the red object signal is normalized for phase area, it
is clear the internalization response size is depending
on cell number (C and D). All data shown as a mean
of 3 wells ± SEM, bar graphs shown as area under the
curve (AUC) calculated from time-course data.
66