Page 71 - Live-cellanalysis handbook
P. 71

Kinetic Antibody Internalization Assays


           Quantitative Pharmacological Analysis
           Pharmacological, kinetic quantification of antibody internalization

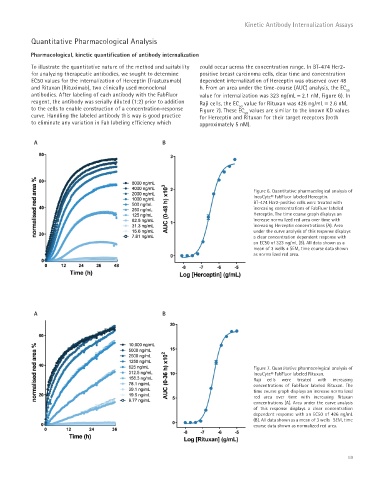
           To illustrate the quantitative nature of the method and suitability   could occur across the concentration range. In BT-474 Her2-
           for analyzing therapeutic antibodies, we sought to determine   positive breast carcinoma cells, clear time and concentration
           EC50 values for the internalization of Herceptin (Trastuzumab)   dependent internalization of Herceptin was observed over 48
           and Rituxan (Rituximab), two clinically used monoclonal   h. From an area under the time-course (AUC) analysis, the EC
                                                                                                                    50
           antibodies. After labeling of each antibody with the FabFluor   value for internalization was 323 ng/mL ≡ 2.1 nM, Figure 6). In
           reagent, the antibody was serially diluted (1:2) prior to addition   Raji cells, the EC  value for Rituxan was 426 ng/mL ≡ 2.6 nM,
                                                                                50
           to the cells to enable construction of a concentration-response   Figure 7). These EC  values are similar to the known KD values
                                                                                  50
           curve. Handling the labeled antibody this way is good practice   for Herceptin and Rituxan for their target receptors (both
           to eliminate any variation in Fab labeling efficiency which   approximately 5 nM).

            A                                          B


                                                                                     Figure 6. Quantitative pharmacological analysis of
                                                                                     IncuCyte® FabFluor labeled Herceptin.
                                                                                     BT-474 Her2-positive cells were treated with
                                                                                     increasing concentrations of FabFluor labeled
                                                                                     Herceptin. The time course graph displays an
                                                                                     increase normalized red area over time with
                                                                                     increasing Herceptin concentrations (A). Area
                                                                                     under the curve analysis of this response displays
                                                                                     a clear concentration dependent response with
                                                                                     an EC50 of 323 ng/mL (B). All data shown as a
                                                                                     mean of 3 wells ± SEM, time course data shown
                                                                                     as normalized red area.


            A                                          B


                                                                                     Figure 7. Quantitative pharmacological analysis of
                                                                                     IncuCyte® FabFluor labeled Rituxan.
                                                                                     Raji cells were treated with increasing
                                                                                     concentrations  of  FabFluor  labeled  Rituxan.  The
                                                                                     time course graph displays an increase normalized
                                                                                     red area over time with increasing Rituxan
                                                                                     concentrations (A). Area under the curve analysis
                                                                                     of this response displays a clear concentration
                                                                                     dependent response with an EC50 of 426 ng/mL
                                                                                     (B). All data shown as a mean of 3 wells   SEM, time
                                                                                     course data shown as normalized red area.


                                                                                                                    69
   66   67   68   69   70   71   72   73   74   75   76