
Page 24 - Rapid Review of ECG Interpretation in Small Animal Practice, 2nd Edition
P. 24
Section 2
VetBooks.ir EVALUATION OF THE
ELECTROCARDIOGRAM
Evaluation of the ECG is best performed of squares and performing a few easy calculations
using a systematic approach so that important to convert each value to either seconds or millivolts,
characteristics are not overlooked. Important respectively.
features that require analysis include heart rate,
rhythm, mean electrical axis (MEA), waveform
morphology, and criteria for heart enlargement.
This section provides a step-by-step guide on how
to evaluate each of these features, but first, one
must understand how paper speed and sensitivity
settings affect ECG interpretation.
ECG PAPER, SENSITIVITY, AND SPEED
OF RECORDING
ECG paper has a background pattern of 1 mm
squares and bold division lines every 5 mm in both
horizontal and vertical directions (large squares).
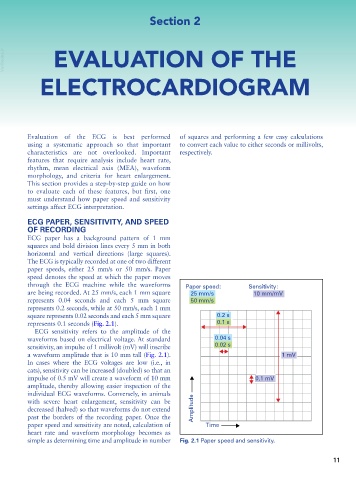
The ECG is typically recorded at one of two different
paper speeds, either 25 mm/s or 50 mm/s. Paper
speed denotes the speed at which the paper moves
through the ECG machine while the waveforms Paper speed: Sensitivity:
are being recorded. At 25 mm/s, each 1 mm square 25 mm/s 10 mm/mV
represents 0.04 seconds and each 5 mm square 50 mm/s
represents 0.2 seconds, while at 50 mm/s, each 1 mm
square represents 0.02 seconds and each 5 mm square 0.2 s
represents 0.1 seconds (Fig. 2.1). 0.1 s
ECG sensitivity refers to the amplitude of the
waveforms based on electrical voltage. At standard 0.04 s
sensitivity, an impulse of 1 millivolt (mV) will inscribe 0.02 s
a waveform amplitude that is 10 mm tall (Fig. 2.1). 1 mV
In cases where the ECG voltages are low (i.e., in
cats), sensitivity can be increased (doubled) so that an
impulse of 0.5 mV will create a waveform of 10 mm 0.1 mV
amplitude, thereby allowing easier inspection of the
individual ECG waveforms. Conversely, in animals
with severe heart enlargement, sensitivity can be
decreased (halved) so that waveforms do not extend Amplitude
past the borders of the recording paper. Once the
paper speed and sensitivity are noted, calculation of Time
heart rate and waveform morphology becomes as
simple as determining time and amplitude in number Fig. 2.1 Paper speed and sensitivity.
11