
Page 635 - The Toxicology of Fishes
P. 635
Toxicity Resistance 615
420 nm
590 nm
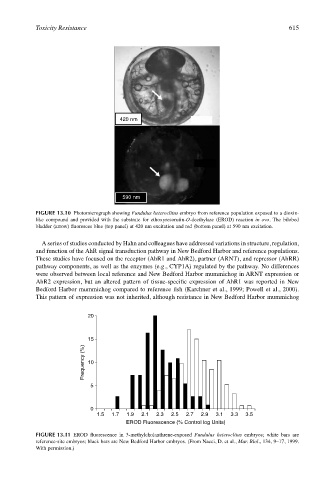
FIGURE 13.10 Photomicrograph showing Fundulus heteroclitus embryo from reference population exposed to a dioxin-
like compound and provided with the substrate for ethoxyresorufin-O-deethylase (EROD) reaction in ovo. The bilobed
bladder (arrow) fluoresces blue (top panel) at 420 nm excitation and red (bottom panel) at 590 nm excitation.
A series of studies conducted by Hahn and colleagues have addressed variations in structure, regulation,
and function of the AhR signal transduction pathway in New Bedford Harbor and reference populations.
These studies have focused on the receptor (AhR1 and AhR2), partner (ARNT), and repressor (AhRR)
pathway components, as well as the enzymes (e.g., CYP1A) regulated by the pathway. No differences
were observed between local reference and New Bedford Harbor mummichog in ARNT expression or
AhR2 expression, but an altered pattern of tissue-specific expression of AhR1 was reported in New
Bedford Harbor mummichog compared to reference fish (Karchner et al., 1999; Powell et al., 2000).
This pattern of expression was not inherited, although resistance in New Bedford Harbor mummichog
20
15
Frequency (%) 10
5
0
1.5 1.7 1.9 2.1 2.3 2.5 2.7 2.9 3.1 3.3 3.5
EROD Fluorescence (% Control log Units)
FIGURE 13.11 EROD fluorescence in 3-methylcholanthrene-exposed Fundulus heteroclitus embryos; white bars are
reference-site embryos; black bars are New Bedford Harbor embryos. (From Nacci, D. et al., Mar. Biol., 134, 9–17, 1999.
With permission.)