
Page 127 - Basic Monitoring in Canine and Feline Emergency Patients
P. 127
In a clinical situation, it is important to interpret deal of information, sometimes even making the
the information provided by capnometry (i.e. the difference between life and death for the patient. A
VetBooks.ir numerical value of ETCO ) along with capnogra- normal capnogram shows a regular, nearly square
2
phy (the graphic representation of the waveform).
waveform that represents the inhalation of CO -
2
Numerical values should be used as a tool in
2
from the alveoli to the mouth during expiration.
evaluation of the overall ventilatory status of the free gases during inspiration and the path of CO
patient while the shapes of the waveforms offer There is a very small volume of breath that does
more specific diagnostic clues. not participate in gas exchange (it is CO free)
2
called respiratory dead space. This anatomic dead
space represents the total volume of the conducting
Capnometry
airways from the nose or mouth down to the level
There are four major causes for increases or of the terminal bronchioles. The dead space can be
decreases in the numerical values of the ETCO : increased in intubated patients due to presence of
2
● ● cellular/metabolic reasons (changes in the rate of endotracheal tubes that are too long or additional
tubing added to the anesthesia circuit (i.e. choosing
CO production in the tissues) as seen with an anesthesia circuit that is too large for the size of
2
hypothermia, fever, seizures, etc.; the patient).
● ● variations in alveolar ventilation (secondary to When the patient first starts to exhale, there will
pain, bronchospasm, drug therapy, etc.); be no CO detected by the capnograph because the
2
● ● alterations in pulmonary perfusion (changes in gas from the dead space is exhaled first. As the exha-
delivery of blood and CO to the alveoli) as seen lation continues, the concentration of CO increases
2
with cardiac failure, cardiac arrest, pulmonary until it reaches a peak at the end of exhalation; then
2
thromboembolism, etc.; and the CO concentration drops to baseline as the
● ● technical malfunctions of the anesthesia machine. 2
patient starts to inhale CO -free gases. This can be
2
Tables 6.2 and 6.3 summarize the most common seen best on a time capnogram (Fig. 6.8).
causes of increased and decreased ETCO values. As seen in Fig. 6.8, a time capnogram has two
2
important segments – inspiratory and expiratory –
as well as two angles (alpha and beta). The expira-
Capnogram
tory segment of a time capnogram includes phase I,
Understanding waveforms generated during ventila- II and III, while the inspiratory phase includes
tion and how to interpret them can provide a great phase 0 and the beginning of phase I.
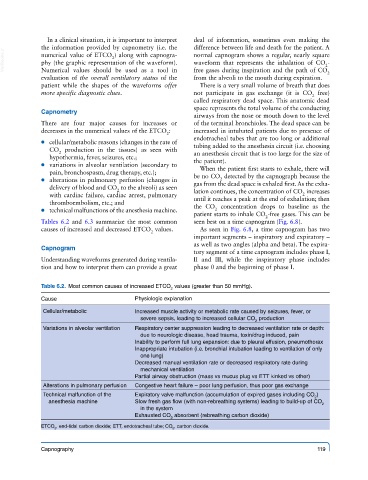
Table 6.2. Most common causes of increased ETCO values (greater than 50 mmHg).
2
Cause Physiologic explanation
Cellular/metabolic Increased muscle activity or metabolic rate caused by seizures, fever, or
severe sepsis, leading to increased cellular CO production
2
Variations in alveolar ventilation Respiratory center suppression leading to decreased ventilation rate or depth:
due to neurologic disease, head trauma, toxin/drug induced, pain
Inability to perform full lung expansion: due to pleural effusion, pneumothorax
Inappropriate intubation (i.e. bronchial intubation leading to ventilation of only
one lung)
Decreased manual ventilation rate or decreased respiratory rate during
mechanical ventilation
Partial airway obstruction (mass vs mucus plug vs ETT kinked vs other)
Alterations in pulmonary perfusion Congestive heart failure – poor lung perfusion, thus poor gas exchange
Technical malfunction of the Expiratory valve malfunction (accumulation of expired gases including CO )
2
anesthesia machine Slow fresh gas flow (with non-rebreathing systems) leading to build-up of CO
2
in the system
Exhausted CO absorbent (rebreathing carbon dioxide)
2
ETCO , end-tidal carbon dioxide; ETT, endotracheal tube; CO , carbon dioxide.
2 2
Capnography 119