
Page 131 - Basic Monitoring in Canine and Feline Emergency Patients
P. 131
ETCO 2
(mmHg)
VetBooks.ir 50
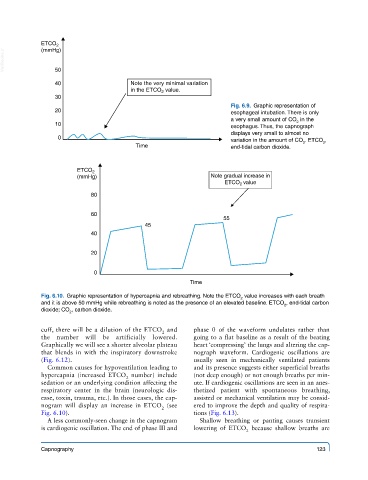
40 Note the very minimal variation
in the ETCO value.
2
30
Fig. 6.9. Graphic representation of
20 esophageal intubation. There is only
a very small amount of CO in the
2
10 esophagus. Thus, the capnograph
displays very small to almost no
0
variation in the amount of CO . ETCO ,
2
2
Time end-tidal carbon dioxide.
ETCO 2
(mmHg) Note gradual increase in
ETCO value
2
80
60
55
45
40
20
0
Time
Fig. 6.10. Graphic representation of hypercapnia and rebreathing. Note the ETCO value increases with each breath
2
and it is above 50 mmHg while rebreathing is noted as the presence of an elevated baseline. ETCO , end-tidal carbon
2
dioxide; CO , carbon dioxide.
2
cuff, there will be a dilution of the ETCO and phase 0 of the waveform undulates rather than
2
the number will be artificially lowered. going to a flat baseline as a result of the beating
Graphically we will see a shorter alveolar plateau heart ‘compressing’ the lungs and altering the cap-
that blends in with the inspiratory downstroke nograph waveform. Cardiogenic oscillations are
(Fig. 6.12). usually seen in mechanically ventilated patients
Common causes for hypoventilation leading to and its presence suggests either superficial breaths
hypercapnia (increased ETCO number) include (not deep enough) or not enough breaths per min-
2
sedation or an underlying condition affecting the ute. If cardiogenic oscillations are seen in an anes-
respiratory center in the brain (neurologic dis- thetized patient with spontaneous breathing,
ease, toxin, trauma, etc.). In those cases, the cap- assisted or mechanical ventilation may be consid-
nogram will display an increase in ETCO (see ered to improve the depth and quality of respira-
2
Fig. 6.10). tions (Fig. 6.13).
A less commonly-seen change in the capnogram Shallow breathing or panting causes transient
is cardiogenic oscillation. The end of phase III and lowering of ETCO because shallow breaths are
2
Capnography 123