
Page 174 - Veterinary Toxicology, Basic and Clinical Principles, 3rd Edition
P. 174
Toxicokinetics Chapter | 8 141
VetBooks.ir Model Validation be used to generate specific values for the parameters in
question. This parameter value assignment is repeated a
Model validation refers to the process of confirming that
large number of times, and the output becomes a set of
the model actually achieves its intended purpose. In most
simulations that can be plotted alongside each other. This
situations, this will involve confirmation that the model is
gives a visual representation of what a population may
predictive under the conditions of its intended use. This
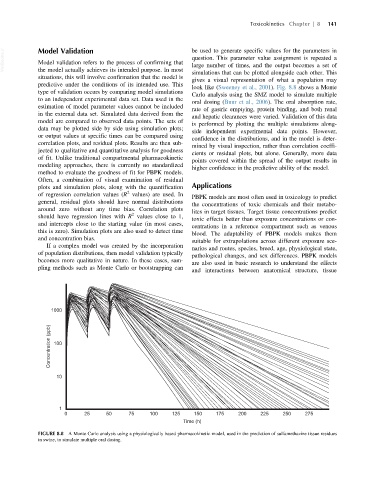
look like (Sweeney et al., 2001). Fig. 8.8 shows a Monte
type of validation occurs by comparing model simulations
Carlo analysis using the SMZ model to simulate multiple
to an independent experimental data set. Data used in the
oral dosing (Buur et al., 2006). The oral absorption rate,
estimation of model parameter values cannot be included
rate of gastric emptying, protein binding, and both renal
in the external data set. Simulated data derived from the
and hepatic clearances were varied. Validation of this data
model are compared to observed data points. The sets of
is performed by plotting the multiple simulations along-
data may be plotted side by side using simulation plots;
side independent experimental data points. However,
or output values at specific times can be compared using
confidence in the distributions, and in the model is deter-
correlation plots, and residual plots. Results are then sub-
mined by visual inspection, rather than correlation coeffi-
jected to qualitative and quantitative analysis for goodness
cients or residual plots, but alone. Generally, more data
of fit. Unlike traditional compartmental pharmacokinetic
points covered within the spread of the output results in
modeling approaches, there is currently no standardized
higher confidence in the predictive ability of the model.
method to evaluate the goodness of fit for PBPK models.
Often, a combination of visual examination of residual
plots and simulation plots, along with the quantification Applications
2
of regression correlation values (R values) are used. In
PBPK models are most often used in toxicology to predict
general, residual plots should have normal distributions
the concentrations of toxic chemicals and their metabo-
around zero without any time bias. Correlation plots lites in target tissues. Target tissue concentrations predict
2
should have regression lines with R values close to 1,
toxic effects better than exposure concentrations or con-
and intercepts close to the starting value (in most cases,
centrations in a reference compartment such as venous
this is zero). Simulation plots are also used to detect time
blood. The adaptability of PBPK models makes them
and concentration bias.
suitable for extrapolations across different exposure sce-
If a complex model was created by the incorporation
narios and routes, species, breed, age, physiological state,
of population distributions, then model validation typically
pathological changes, and sex differences. PBPK models
becomes more qualitative in nature. In these cases, sam-
are also used in basic research to understand the effects
pling methods such as Monte Carlo or bootstrapping can
and interactions between anatomical structure, tissue
1000
Concentration (ppb) 100
10
1
0 25 50 75 100 125 150 175 200 225 250 275
Time (h)
FIGURE 8.8 A Monte Carlo analysis using a physiologically based pharmacokinetic model, used in the prediction of sulfamethazine tissue residues
in swine, to simulate multiple oral dosing.