
Page 98 - Linear Models for the Prediction of Animal Breeding Values 3rd Edition
P. 98
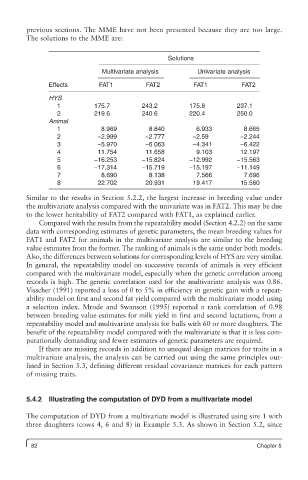
previous sections. The MME have not been presented because they are too large.
         The solutions to the MME are:

                                                 Solutions

                              Multivariate analysis      Univariate analysis
               Effects       FAT1          FAT2         FAT1          FAT2
               HYS
                 1          175.7         243.2        175.8         237.1
                 2          219.6         240.6        220.4         250.0
               Animal
                 1            8.969         8.840        6.933         8.665
                 2           −2.999       −2.777        −2.59         −2.244
                 3           −5.970       −6.063        −4.341        −6.422
                 4           11.754        11.658        9.103        12.197
                 5          −16.253       −15.824      −12.992       −15.563
                 6          −17.314       −15.719      −15.197       −11.149
                 7            8.690         8.138        7.566         7.696
                 8           22.702        20.931       19.417        15.560

         Similar to the results in Section 5.2.2, the largest increase in breeding value under
         the multivariate analysis compared with the univariate was in FAT2. This may be due
         to the lower heritability of FAT2 compared with FAT1, as explained earlier.
            Compared with the results from the repeatability model (Section 4.2.2) on the same
         data with corresponding estimates of genetic parameters, the mean breeding values for
         FAT1 and FAT2 for animals in the multivariate analysis are similar to the breeding
         value estimates from the former. The ranking of animals is the same under both models.
         Also, the differences between solutions for corresponding levels of HYS are very similar.
         In general, the repeatability model on successive records of animals is very efficient
         compared with the multivariate model, especially when the genetic correlation among
         records is high. The genetic correlation used for the multivariate analysis was 0.86.
         Visscher (1991) reported a loss of 0 to 5% in efficiency in genetic gain with a repeat-
         ability model on first and second fat yield compared with the multivariate model using
         a selection index. Mrode and Swanson (1995) reported a rank correlation of 0.98
         between breeding value estimates for milk yield in first and second lactations, from a
         repeatability model and multivariate analysis for bulls with 60 or more daughters. The
         benefit of the repeatability model compared with the multivariate is that it is less com-
         putationally demanding and fewer estimates of genetic parameters are required.
            If there are missing records in addition to unequal design matrices for traits in a
         multivariate analysis, the analysis can be carried out using the same principles out-
         lined in Section 5.3, defining different residual covariance matrices for each pattern
         of missing traits.


         5.4.2  Illustrating the computation of DYD from a multivariate model

         The computation of DYD from a multivariate model is illustrated using sire 1 with
         three daughters (cows 4, 6 and 8) in Example 5.3. As shown in Section 5.2, since


          82                                                              Chapter 5