
Page 96 - Linear Models for the Prediction of Animal Breeding Values 3rd Edition
P. 96
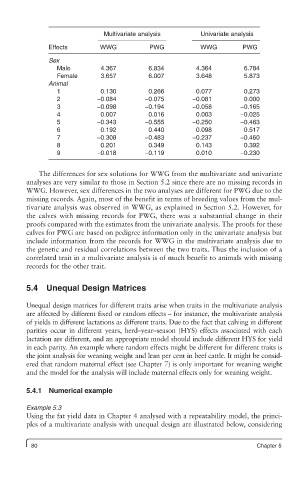
Multivariate analysis      Univariate analysis
               Effects        WWG           PWG           WWG         PWG

               Sex
                 Male         4.367        6.834         4.364         6.784
                 Female       3.657        6.007         3.648         5.873
               Animal
                 1            0.130        0.266         0.077         0.273
                 2           −0.084       −0.075        −0.081         0.000
                 3           −0.098       −0.194        −0.058        −0.165
                 4            0.007        0.016         0.003        −0.025
                 5           −0.343       −0.555        −0.250        −0.463
                 6            0.192        0.440         0.098         0.517
                 7           −0.308       −0.483        −0.237        −0.460
                 8            0.201        0.349         0.143         0.392
                 9           −0.018       −0.119         0.010        −0.230


            The differences for sex solutions for WWG from the multivariate and univariate
         analyses are very similar to those in Section 5.2 since there are no missing records in
         WWG. However, sex differences in the two analyses are different for PWG due to the
         missing records. Again, most of the benefit in terms of breeding values from the mul-
         tivariate analysis was observed in WWG, as explained in Section 5.2. However, for
         the calves with missing records for PWG, there was a substantial change in their
         proofs compared with the estimates from the univariate analysis. The proofs for these
         calves for PWG are based on pedigree information only in the univariate analysis but
         include information from the records for WWG in the multivariate analysis due to
         the genetic and residual correlations between the two traits. Thus the inclusion of a
         correlated trait in a multivariate analysis is of much benefit to animals with missing
         records for the other trait.


         5.4 Unequal Design Matrices

         Unequal design matrices for different traits arise when traits in the multivariate analysis
         are affected by different fixed or random effects – for instance, the multivariate analysis
         of yields in different lactations as different traits. Due to the fact that calving in different
         parities occur in different years, herd–year–season (HYS) effects associated with each
         lactation are different, and an appropriate model should include different HYS for yield
         in each parity. An example where random effects might be different for different traits is
         the joint analysis for weaning weight and lean per cent in beef cattle. It might be consid-
         ered that random maternal effect (see Chapter 7) is only important for weaning weight
         and the model for the analysis will include maternal effects only for weaning weight.

         5.4.1  Numerical example

         Example 5.3
         Using the fat yield data in Chapter 4 analysed with a repeatability model, the princi-
         ples of a multivariate analysis with unequal design are illustrated below, considering


          80                                                              Chapter 5