
Page 92 - Linear Models for the Prediction of Animal Breeding Values 3rd Edition
P. 92
In both traits, the contributions from PA accounted for about 26% of the breeding
value of the calf.
In general, the estimates of breeding value for PWG from the multivariate
analysis above are similar to those from the univariate analysis. The maximum
difference between the multivariate and univariate breeding values is 0.008 kg
(calf 8). The similarity of the evaluations for PWG from both models is due to the
fact that genetic regression of WWG on PWG (0.45) is almost equal to the pheno-
typic regression (0.41) (Thompson and Meyer, 1986). However, the breeding val-
ues for WWG from the multivariate analysis are higher than those from the
univariate analysis, with a maximum difference of 0.10 kg (calf 8) in favour of the
multivariate analysis. Thus much of the gain from the multivariate analysis is in
WWG and this is due to its lower heritability, as mentioned earlier. However, there
was only a slight re-ranking of animals for both traits in the multivariate analysis.
5.2.4 Accuracy of multivariate evaluations
One of the main advantages of MBLUP is the increase in the accuracy of evaluations.
Presented below are estimates of reliabilities for the proofs for WWG and PWG from
the multivariate analysis and the univariate analysis of each trait.
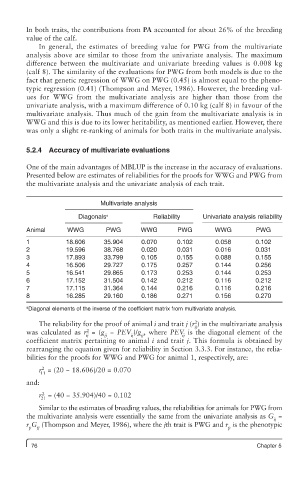
Multivariate analysis
Diagonals a Reliability Univariate analysis reliability
Animal WWG PWG WWG PWG WWG PWG
1 18.606 35.904 0.070 0.102 0.058 0.102
2 19.596 38.768 0.020 0.031 0.016 0.031
3 17.893 33.799 0.105 0.155 0.088 0.155
4 16.506 29.727 0.175 0.257 0.144 0.256
5 16.541 29.865 0.173 0.253 0.144 0.253
6 17.152 31.504 0.142 0.212 0.116 0.212
7 17.115 31.364 0.144 0.216 0.116 0.216
8 16.285 29.160 0.186 0.271 0.156 0.270
a Diagonal elements of the inverse of the coefficient matrix from multivariate analysis.
2
The reliability for the proof of animal i and trait j (r ) in the multivariate analysis
ij
2
was calculated as r = (g − PEV )/g , where PEV is the diagonal element of the
ij jj ij jj ij
coefficient matrix pertaining to animal i and trait j. This formula is obtained by
rearranging the equation given for reliability in Section 3.3.3. For instance, the relia-
bilities for the proofs for WWG and PWG for animal 1, respectively, are:
2
r = (20 − 18.606)/20 = 0.070
11
and:
2
r = (40 − 35.904)/40 = 0.102
21
Similar to the estimates of breeding values, the reliabilities for animals for PWG from
the multivariate analysis were essentially the same from the univariate analysis as G =
ij
r G (Thompson and Meyer, 1986), where the jth trait is PWG and r is the phenotypic
p jj p
76 Chapter 5