
Page 147 - Feline diagnostic imaging
P. 147
146 8 Diseases of the Eye
formed and compared to the postmortem examination;
only the use of MRI delineated the exact borders of the
neoplasm [85].
The CT imaging features detected significantly more
frequently in neoplastic than nonneoplastic disease
included focal mass effect, clearly delineated mar-
gins, bony involvement, and extraorbital extension
(Figures 8.18–8.21) [8]. Lesions affecting orbital bone
and anterior ocular structures were found to be predic-
tive of neoplasia, and abnormalities affecting extraconal
fat and skin were predictive of inflammatory conditions
[81]. CT is very sensitive for identifying bone lysis,
which is highly suggestive of orbital malignancy in
the cat; a study showed evidence of bony lysis has
been reported in 82% of cats with orbital malignancy
although fungal cellulitis has also been associated
with bony lysis, but the extent of lysis is typically less
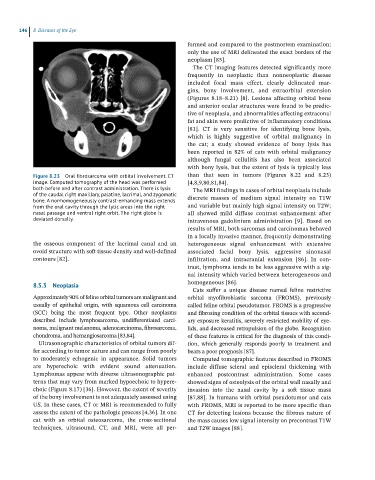
Figure 8.23 Oral fibrosarcoma with orbital involvement. CT than that seen in tumors (Figures 8.22 and 8.23)
image. Computed tomography of the head was performed [4,8,9,80,81,84].
both before and after contrast administration. There is lysis The MRI findings in cases of orbital neoplasia include
of the caudal right maxillary, palatine, lacrimal, and zygomatic discrete masses of medium signal intensity on T1W
bone. A nonhomogeneously contrast-enhancing mass extends
from the oral cavity through the lytic areas into the right and variable but mainly high signal intensity on T2W;
nasal passage and ventral right orbit. The right globe is all showed mild diffuse contrast enhancement after
deviated dorsally. intravenous gadolinium administration [9]. Based on
results of MRI, both sarcomas and carcinomas behaved
in a locally invasive manner, frequently demonstrating
the osseous component of the lacrimal canal and an heterogeneous signal enhancement with extensive
ovoid structure with soft tissue density and well‐defined associated facial bony lysis, aggressive sinonasal
contours [82]. infiltration, and intracranial extension [86]. In con-
trast, lymphoma tends to be less aggressive with a sig -
nal intensity which varied between heterogeneous and
8.5.3 Neoplasia homogeneous [86].
Cats suffer a unique disease named feline restrictive
Approximately 90% of feline orbital tumors are malignant and orbital myofibroblastic sarcoma (FROMS), previously
usually of epithelial origin, with squamous cell carcinoma called feline orbital pseudotumor. FROMS is a progressive
(SCC) being the most frequent type. Other neoplasms and fibrosing condition of the orbital tissues with second-
described include lymphosarcoma, undifferentiated carci- ary exposure keratitis, severely restricted mobility of eye-
noma, malignant melanoma, adenocarcinoma, fibrosarcoma, lids, and decreased retropulsion of the globe. Recognition
chondroma, and hemangiosarcoma [83,84]. of these features is critical for the diagnosis of this condi-
Ultrasonographic characteristics of orbital tumors dif- tion, which generally responds poorly to treatment and
fer according to tumor nature and can range from poorly bears a poor prognosis [87].
to moderately echogenic in appearance. Solid tumors Computed tomographic features described in FROMS
are hyperechoic with evident sound attenuation. include diffuse scleral and episcleral thickening with
Lymphomas appear with diverse ultrasonographic pat- enhanced postcontrast administration. Some cases
terns that may vary from marked hypoechoic to hypere - showed signs of osteolysis of the orbital wall nasally and
choic (Figure 8.17) [36]. However, the extent of severity invasion into the nasal cavity by a soft tissue mass
of the bony involvement is not adequately assessed using [87,88]. In humans with orbital pseudotumor and cats
US. In these cases, CT or MRI is recommended to fully with FROMS, MRI is reported to be more specific than
assess the extent of the pathologic process [4,36]. In one CT for detecting lesions because the fibrous nature of
cat with an orbital osteosarcoma, the cross‐sectional the mass causes low signal intensity on precontrast T1W
techniques, ultrasound, CT, and MRI, were all per- and T2W images [88].