
Page 313 - The Welfare of Cattle
P. 313
290 the WeLfare of CattLe
COW WeLFare aND tODaY’S DaIrY PrODUCtION SYSteM
Across time cattle have represented, and represent today, different values to individuals based
on time, place and culture including: status, wealth, food, currency, power, fuel, food, fertilizer,
heat, fat, and textiles. These value differences likely have an influence on the principles that are the
1
foundation of how cattle are considered and treated. What isn’t different is the fact that healthy cows
produce more with fewer expenses than unhealthy cows, so every producer has a vested interest in
caring for their cattle.
Dairy farms today are the product of economic, market, environmental, and legislative forces
that have shaped it with rapid change starting in about 1950 and continuing today. Half of US dairy
herds disappeared between 1950 and 1975, and another 18% were lost between 1975 and 2000.
From 1950 to 1975 milk production per cow almost doubled, and it grew another 76% between 1975
and 2000. Since then production per cow has continued to climb and milk quality has improved.
3
Technology, specialization, advances in nutrition, health, managing cows and a trained labor force,
and other improvements, all contributed to these changes.
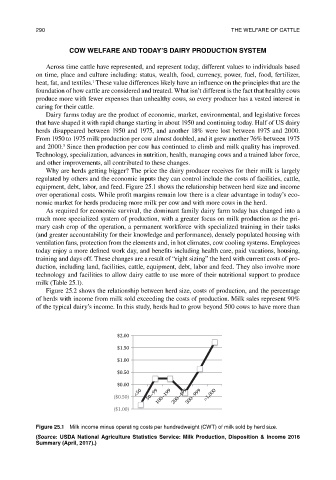
Why are herds getting bigger? The price the dairy producer receives for their milk is largely
regulated by others and the economic inputs they can control include the costs of facilities, cattle,
equipment, debt, labor, and feed. Figure 25.1 shows the relationship between herd size and income
over operational costs. While profit margins remain low there is a clear advantage in today’s eco-
nomic market for herds producing more milk per cow and with more cows in the herd.
As required for economic survival, the dominant family dairy farm today has changed into a
much more specialized system of production, with a greater focus on milk production as the pri-
mary cash crop of the operation, a permanent workforce with specialized training in their tasks
(and greater accountability for their knowledge and performance), densely populated housing with
ventilation fans, protection from the elements and, in hot climates, cow cooling systems. Employees
today enjoy a more defined work day, and benefits including health care, paid vacations, housing,
training and days off. These changes are a result of “right sizing” the herd with current costs of pro-
duction, including land, facilities, cattle, equipment, debt, labor and feed. They also involve more
technology and facilities to allow dairy cattle to use more of their nutritional support to produce
milk (Table 25.1).
Figure 25.2 shows the relationship between herd size, costs of production, and the percentage
of herds with income from milk sold exceeding the costs of production. Milk sales represent 90%
of the typical dairy’s income. In this study, herds had to grow beyond 500 cows to have more than
$2.00
$1.50
$1.00
$0.50
$0.00
<50
($0.50) 50–99 100–199 200–499 500–999 >1,000
($1.00)
Figure 25.1 Milk income minus operating costs per hundredweight (CWt) of milk sold by herd size.
(Source: USDa National agriculture Statistics Service: Milk Production, Disposition & Income 2016
Summary (april, 2017).)