
Page 314 - The Welfare of Cattle
P. 314
daIrY CoW WeLfare and herd turnoVer rates 291
table 25.1 Changing % of National Dairy herd in Small vs. Large Dairies
Year % Share of Cows in herds < 100 Cows % Share of Cows in herds > 999 Cows
1992 49 10
1997 39 18
2002 29 29
2007 21 40
2012 11 49
Source: usda Census of agriculture.
90
82.4
80
70
62.7
60
50
Cost $/CWT $39.11 42.1
40
% Farms income $30.24
exceeds costs 30 $24.25 23.8
19.5
20 $22.00 $18.09 $16.37
$13.80
10 6.5
2.8
0
1–49 50–99 100–199 200–499 500–999 1,000–1,999 >1,999
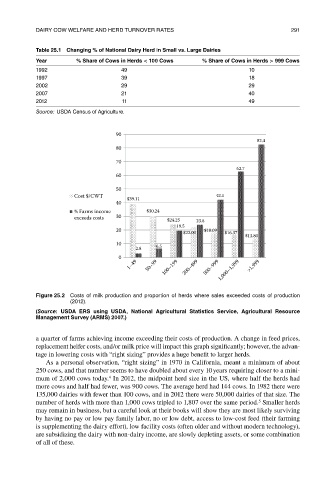
Figure 25.2 Costs of milk production and proportion of herds where sales exceeded costs of production
(2012).
(Source: USDa erS using USDa, National agricultural Statistics Service, agricultural resource
Management Survey (arMS) 2007.)
a quarter of farms achieving income exceeding their costs of production. A change in feed prices,
replacement heifer costs, and/or milk price will impact this graph significantly; however, the advan-
tage in lowering costs with “right sizing” provides a huge benefit to larger herds.
As a personal observation, “right sizing” in 1970 in California, meant a minimum of about
250 cows, and that number seems to have doubled about every 10 years requiring closer to a mini-
4
mum of 2,000 cows today. In 2012, the midpoint herd size in the US, where half the herds had
more cows and half had fewer, was 900 cows. The average herd had 144 cows. In 1982 there were
135,000 dairies with fewer than 100 cows, and in 2012 there were 50,000 dairies of that size. The
number of herds with more than 1,000 cows tripled to 1,807 over the same period. Smaller herds
5
may remain in business, but a careful look at their books will show they are most likely surviving
by having no pay or low pay family labor, no or low debt, access to low-cost feed (their farming
is supplementing the dairy effort), low facility costs (often older and without modern technology),
are subsidizing the dairy with non-dairy income, are slowly depleting assets, or some combination
of all of these.