
Page 316 - The Welfare of Cattle
P. 316
daIrY CoW WeLfare and herd turnoVer rates 293
12
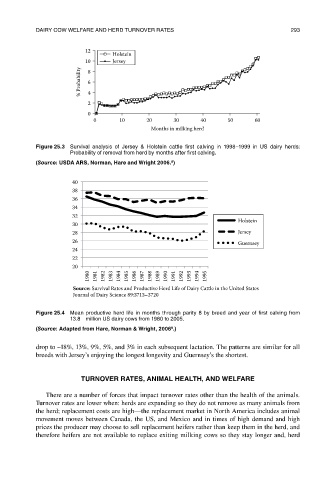
Holstein
10 Jersey
% Probability 8 6 4
2
0
0 10 20 30 40 50 60
Months in milking herd
Figure 25.3 survival analysis of Jersey & holstein cattle first calving in 1998–1999 in us dairy herds:
Probability of removal from herd by months after first calving.
(Source: USDa arS, Norman, hare and Wright 2006. )
8
40
38
36
34
32
30 Holstein
28 Jersey
26 Guernsey
24
22
20
1980 1981 1982 1983 1984 1985 1986 1987 1988 1989 1990 1991 1992 1993 1994 1995
Source: Survival Rates and Productive Herd Life of Dairy Cattle in the United States
Journal of Dairy Science 89:3713–3720
Figure 25.4 Mean productive herd life in months through parity 8 by breed and year of first calving from
13.8 million us dairy cows from 1980 to 2005.
(Source: adapted from hare, Norman & Wright, 2006 .)
9
drop to ~18%, 13%, 9%, 5%, and 3% in each subsequent lactation. The patterns are similar for all
breeds with Jersey’s enjoying the longest longevity and Guernsey’s the shortest.
tUrNOVer rateS, aNIMaL heaLth, aND WeLFare
There are a number of forces that impact turnover rates other than the health of the animals.
Turnover rates are lower when: herds are expanding so they do not remove as many animals from
the herd; replacement costs are high—the replacement market in North America includes animal
movement moves between Canada, the US, and Mexico and in times of high demand and high
prices the producer may choose to sell replacement heifers rather than keep them in the herd, and
therefore heifers are not available to replace exiting milking cows so they stay longer and, herd