
Page 321 - The Welfare of Cattle
P. 321
298 the WeLfare of CattLe
The reasons reported for live removals and on-farm deaths represent “buckets” each holding
many possible problems rather than distinctly different reasons. If reasons were more accurately and
consistently reported within a herd and between herds it would be possible to better focus treatment
and, more importantly, prevention programs. Persistent Bovine Virus Diarrhea, Bovine Leukosis,
Johne’s disease and neospora-associated abortions remain challenges in the dairy industry and are
likely significant “silent” contributors to live removals and on-farm deaths.
It’s been recommended that DHI record centers adopt USDA’s Animal Improvement
Program Laboratory (AIPL) listing of health trait terms to improve the usefulness of the rea-
sons captured. The terms include: Cystic Ovary, Diarrhea/Scours, Digestive Problem/Off Feed,
Displaced Abomasum, Downer Cow, Dystocia, Johne’s Disease (Clinical), Ketosis/Acetonemia,
Lameness, Mastitis (Clinical), Metritis, Milk Fever/Hypocalcemia, Nervous System Problem,
Other Reproductive Problem, Respiratory Problem, Retained Placenta, Stillbirth, Teat Injury and
Udder Edema. Other non-disease traits recommended for adoption include: Body Condition Score,
13
Milking Speed and Temperament. Collection of this kind of detail is a necessary step toward fos-
tering better management and prevention health programs.
Many published studies report annualized death rates of around 6% of the herd. Risk factors
reported vary widely and include larger herd size, higher milk production per cow, and prob-
lems associated with calving including retained placenta, dystocia, and metritis. The 2013 USDA
14
NAHMS report notes similar death rates across small, medium, and large dairies, averaging 4.8%.
This study included data from 17 states, 76% of the nation’s dairies, and 80% of the nation’s cows.
Calving’s reported as stillbirths had the highest rates in the smallest herds and the lowest rates in
the largest herds. This likely is associated with dedicated employees trained and responsible for
managing deliveries and more frequent maternity pen checks in larger herds with day and night
shifts caring for the cattle.
Pinedo et al., Hadley et al., and USDA report higher on-farm death risks for cows in their later
15
lactations. Annualized live removal and on-farm death rates were lower in higher producing cows
in the USDA study.
Cow deaths in a 2007 USDA Dairy Survey, as reported by producers, listed from highest to
lowest frequency, were: lameness or injury (20.0%); mastitis (16.5%); calving problems (15.2%);
unknown (15.0%); respiratory problems (11.3%); diarrhea or other digestive problems (10.4%); other
known reasons (10.2%); nervous condition or lack of coordination (1.0%); and poison (0.4%). These
results represented data from 13.6% herds with <100 cows, 32.6% herds with 100–499 cows, and
53.8% from herds with 500 or more cows. Only about 4% of deaths were necropsied to determine
a more definitive cause of death. All deaths are animal welfare concerns, but combining all these
22
conditions into one figure reported as “on-farm death” makes interpretation very difficult.
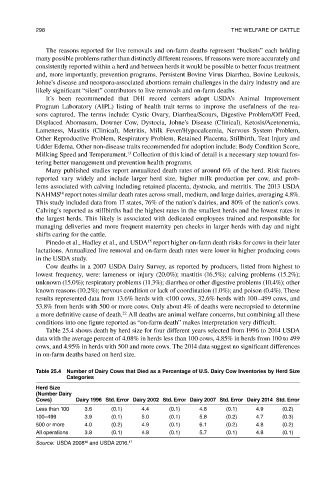
Table 25.4 shows death by herd size for four different years selected from 1996 to 2014 USDA
data with the average percent of 4.08% in herds less than 100 cows, 4.85% in herds from 100 to 499
cows, and 4.95% in herds with 500 and more cows. The 2014 data suggest no significant differences
in on-farm deaths based on herd size.
table 25.4 Number of Dairy Cows that Died as a Percentage of U.S. Dairy Cow Inventories by herd Size
Categories
herd Size
(Number Dairy
Cows) Dairy 1996 Std. error Dairy 2002 Std. error Dairy 2007 Std. error Dairy 2014 Std. error
Less than 100 3.6 (0.1) 4.4 (0.1) 4.8 (0.1) 4.9 (0.2)
100–499 3.9 (0.1) 5.0 (0.1) 5.8 (0.2) 4.7 (0.3)
500 or more 4.0 (0.2) 4.9 (0.1) 6.1 (0.2) 4.8 (0.2)
all operations 3.8 (0.1) 4.8 (0.1) 5.7 (0.1) 4.8 (0.1)
Source: usda 2008 and usda 2016. 17
16