
Page 324 - The Welfare of Cattle
P. 324
daIrY CoW WeLfare and herd turnoVer rates 301
60
50
40
Culling, % 30
20
10
0
0 100 200 300 400 500
Days after calving
Figure 25.10 distribution of removed cows (%) by disposal codes at different stages of lactation. distribution
of culled cows (%) by disposal codes at different stages of lactation (each day is 100%). disposal
codes: feet and legs (◊), low production (▪), reproduction (▴), injury/other (×), died (*), mastitis (•),
disease (+), udder problems (▬), and reason not reported (clean line). disposal codes: feet and
legs (◊), low production (▪), reproduction (▴), injury/other (×), died (*), mastitis (•), disease (+),
udder problems (▬), and reason not reported (clean line).
(Source: adapted from Pinedo, P., Daniels, a., Shumaker, J., & DeVries, a., 2010. Dynamics of culling
23
risk with disposal codes reported by Dairy herd Improvement dairy herds. Journal of Dairy Science 93,
2250–2261.)
of breed-registered cows in the herd or current or recent herd expansion lowered live-removal rates
as did having a low proportion of replacement heifers to milk cows.
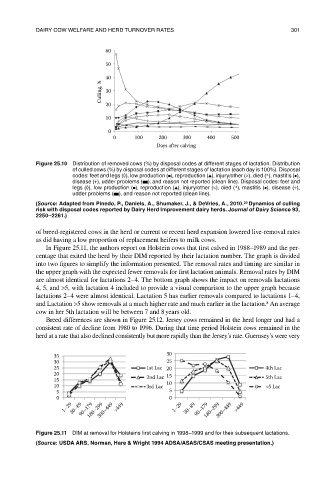
In Figure 25.11, the authors report on Holstein cows that first calved in 1988–1989 and the per-
centage that exited the herd by their DIM reported by their lactation number. The graph is divided
into two figures to simplify the information presented. The removal rates and timing are similar in
the upper graph with the expected fewer removals for first lactation animals. Removal rates by DIM
are almost identical for lactations 2–4. The bottom graph shows the impact on removals lactations
4, 5, and >5, with lactation 4 included to provide a visual comparison to the upper graph because
lactations 2–4 were almost identical. Lactation 5 has earlier removals compared to lactations 1–4,
8
and Lactation >5 show removals at a much higher rate and much earlier in the lactation. An average
cow in her 5th lactation will be between 7 and 8 years old.
Breed differences are shown in Figure 25.12. Jersey cows remained in the herd longer and had a
consistent rate of decline from 1980 to 1996. During that time period Holstein cows remained in the
herd at a rate that also declined consistently but more rapidly than the Jersey’s rate. Guernsey’s were very
35 30
30 25
25 1st Lac 20 4th Lac
20 15
15 2nd Lac 5th Lac
10 3rd Lac 10 >5 Lac
5 5
0 0
1–29 30–89 90–179 180–299 300–449 >449 1–29 30–89 90–179 180–299 300–449 >449
Figure 25.11 dIM at removal for holsteins first calving in 1998–1999 and for their subsequent lactations.
(Source: USDa arS, Norman, hare & Wright 1994 aDSa/aSaS/CSaS meeting presentation.)