
Page 320 - The Welfare of Cattle
P. 320
daIrY CoW WeLfare and herd turnoVer rates 297
40
30
20 P Removed
10 P Died
0 H Removed
100–200 201–500 501–1500 1501–3000 >3000 H Died
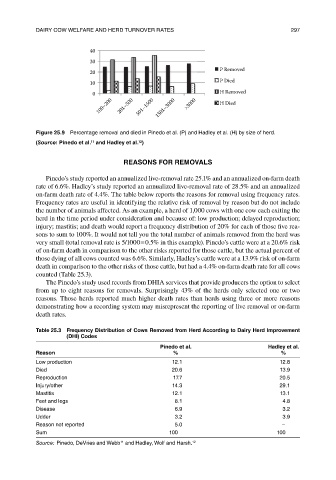
Figure 25.9 Percentage removal and died in Pinedo et al. (P) and hadley et al. (h) by size of herd.
12
11
(Source: Pinedo et al. and hadley et al. )
reaSONS FOr reMOVaLS
Pinedo’s study reported an annualized live-removal rate 25.1% and an annualized on-farm death
rate of 6.6%. Hadley’s study reported an annualized live-removal rate of 28.5% and an annualized
on-farm death rate of 4.4%. The table below reports the reasons for removal using frequency rates.
Frequency rates are useful in identifying the relative risk of removal by reason but do not include
the number of animals affected. As an example, a herd of 1,000 cows with one cow each exiting the
herd in the time period under consideration and because of: low production; delayed reproduction;
injury; mastitis; and death would report a frequency distribution of 20% for each of those five rea-
sons to sum to 100%. It would not tell you the total number of animals removed from the herd was
very small (total removal rate is 5/1000 = 0.5% in this example). Pinedo’s cattle were at a 20.6% risk
of on-farm death in comparison to the other risks reported for those cattle, but the actual percent of
those dying of all cows counted was 6.6%. Similarly, Hadley’s cattle were at a 13.9% risk of on-farm
death in comparison to the other risks of those cattle, but had a 4.4% on-farm death rate for all cows
counted (Table 25.3).
The Pinedo’s study used records from DHIA services that provide producers the option to select
from up to eight reasons for removals. Surprisingly 43% of the herds only selected one or two
reasons. Those herds reported much higher death rates than herds using three or more reasons
demonstrating how a recording system may misrepresent the reporting of live removal or on-farm
death rates.
table 25.3 Frequency Distribution of Cows removed from herd according to Dairy herd Improvement
(DhI) Codes
Pinedo et al. hadley et al.
reason % %
Low production 12.1 12.8
died 20.6 13.9
reproduction 17.7 20.5
Injury/other 14.3 29.1
Mastitis 12.1 13.1
feet and legs 8.1 4.8
disease 6.9 3.2
udder 3.2 3.9
reason not reported 5.0 –
sum 100 100
Source: Pinedo, deVries and Webb and hadley, Wolf and harsh. 12
11