
Page 318 - The Welfare of Cattle
P. 318
daIrY CoW WeLfare and herd turnoVer rates 295
usability of the information. Reasons need to be specific with no or minimal overlap that may result
in errors of assignment and make interpretation more difficult. The goal is to compare a dairy to
itself across time, and to other dairies at a given point in time, to identify where to focus manage-
ment attention for improvement.
The majority of animals removed from dairies are for economic reasons—where the decision is
made to replace that animal with another that has more economic promise or requires fewer farm
resources while in the herd. The replacements, animals that enter the herd to assume the space of
those departing, are usually younger animals who have greater potential due to the accumulated
genetic improvement between the sire’s genetics used at the time of conception of the replacement
vs. the genetics of the sire used to conceive the animal “to be removed”. Animals removed with a
milking herd life of 48 months means the replacement will be 2+ generations “better” than the exit-
ing animal.
The following five tables and figures summarize the live-removal and on-farm death results
11
from one or both of the two large published studies (Pinedo, DeVries & Webb who looked at
records from 3.6 million Holstein lactation records from 2,054 herds from 2001 to 2006, and
12
Hadley, Wolf & Harsh who looked at 1.5 million lactation records from an average of 17,979 herds
per year between 1993 and 1999).
They found as annualized removal rates increase, on-farm death rates decline, and as annual-
ized death rates increase, on-farm removal rates decline. While the data captured in DHIA records
fail to provide a clear understanding as to why these animals died, and provides only general infor-
mation about why they were removed from the herd, there does appear to be a relationship between
herds that remove more live animals having lower on-farm death rates, and herds with higher on-
farm death rates having lower live-removal rates (Table 25.2).
Figure 25.6 demonstrates the rate of live removals and on-farm deaths are associated with more
lactations. The risk of on-farm death appears to increase at almost a constant rate across lactations,
while the risk of live removal accelerates after the third lactation.
Figure 25.7 shows a remarkable association with the risk of removal and failing to be pregnant.
There is also a smaller but still significant risk of on-farm death for cows that are not pregnant. A
part of the on-farm death increase in non-pregnant animals will be related to the period of highest
risk of on-farm death, from calving to about 40 days post calving, when cows are not being insemi-
nated and not pregnant. Other data show delayed conception, conception failure, and conception–
abortion as extremely high risks for live removal and a lack of longevity.
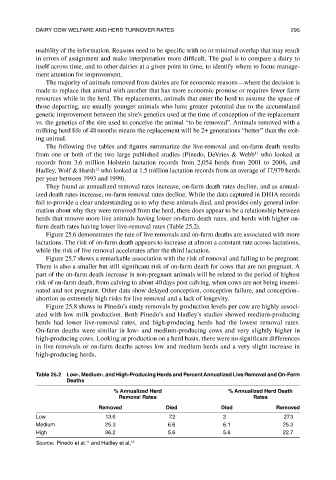
Figure 25.8 shows in Pinedo’s study removals by production levels per cow are highly associ-
ated with low milk production. Both Pinedo’s and Hadley’s studies showed medium- producing
herds had lower live-removal rates, and high-producing herds had the lowest removal rates.
On-farm deaths were similar in low- and medium-producing cows and very slightly higher in
high-producing cows. Looking at production on a herd basis, there were no significant differences
in live removals or on-farm deaths across low and medium herds and a very slight increase in
high-producing herds.
table 25.2 Low-, Medium-, and high-Producing herds and Percent annualized Live removal and On-Farm
Deaths
% annualized herd % annualized herd Death
removal rates rates
removed Died Died removed
Low 13.6 7.2 2 27.3
Medium 25.3 6.6 6.1 25.3
high 36.2 5.6 5.6 22.7
Source: Pinedo et al. and hadley et al. 12
11