
Page 323 - The Welfare of Cattle
P. 323
300 the WeLfare of CattLe
feet and legs and removal for udder problems and speculates these live removals may be for poor
conformation rather than observed health problems. The absolute risk for removal for feet and leg
reasons was twice as high for open vs. pregnant cows indicating the reasons declared are only part
of the story.
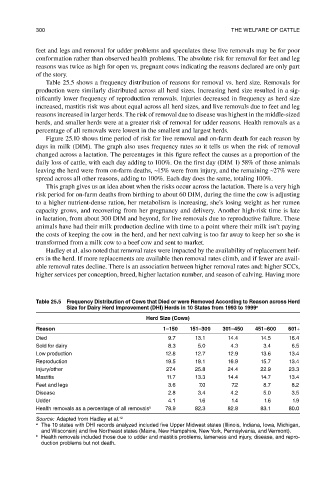
Table 25.5 shows a frequency distribution of reasons for removal vs. herd size. Removals for
production were similarly distributed across all herd sizes. Increasing herd size resulted in a sig-
nificantly lower frequency of reproduction removals. Injuries decreased in frequency as herd size
increased, mastitis risk was about equal across all herd sizes, and live removals due to feet and leg
reasons increased in larger herds. The risk of removal due to disease was highest in the middle-sized
herds, and smaller herds were at a greater risk of removal for udder reasons. Health removals as a
percentage of all removals were lowest in the smallest and largest herds.
Figure 25.10 shows time period of risk for live removal and on-farm death for each reason by
days in milk (DIM). The graph also uses frequency rates so it tells us when the risk of removal
changed across a lactation. The percentages in this figure reflect the causes as a proportion of the
daily loss of cattle, with each day adding to 100%. On the first day (DIM 1) 58% of those animals
leaving the herd were from on-farm deaths, ~15% were from injury, and the remaining ~27% were
spread across all other reasons, adding to 100%. Each day does the same, totaling 100%.
This graph gives us an idea about when the risks occur across the lactation. There is a very high
risk period for on-farm deaths from birthing to about 60 DIM, during the time the cow is adjusting
to a higher nutrient-dense ration, her metabolism is increasing, she’s losing weight as her rumen
capacity grows, and recovering from her pregnancy and delivery. Another high-risk time is late
in lactation, from about 300 DIM and beyond, for live removals due to reproductive failure. These
animals have had their milk production decline with time to a point where their milk isn’t paying
the costs of keeping the cow in the herd, and her next calving is too far away to keep her so she is
transformed from a milk cow to a beef cow and sent to market.
Hadley et al. also noted that removal rates were impacted by the availability of replacement heif-
ers in the herd. If more replacements are available then removal rates climb, and if fewer are avail-
able removal rates decline. There is an association between higher removal rates and: higher SCCs,
higher services per conception, breed, higher lactation number, and season of calving. Having more
table 25.5 Frequency Distribution of Cows that Died or were removed according to reason across herd
Size for Dairy herd Improvement (DhI) herds in 10 States from 1993 to 1999 a
herd Size (Cows)
reason 1–150 151–300 301–450 451–600 601+
died 9.7 13.1 14.4 14.5 16.4
sold for dairy 8.3 5.0 4.3 3.4 6.5
Low production 12.8 12.7 12.9 13.6 13.4
reproduction 19.5 18.1 16.9 15.7 13.4
Injury/other 27.4 25.8 24.4 22.9 23.3
Mastitis 11.7 13.3 14.4 14.7 13.4
feet and legs 3.6 7.0 7.2 8.7 8.2
disease 2.8 3.4 4.2 5.0 3.5
udder 4.1 1.6 1.4 1.6 1.9
health removals as a percentage of all removals b 78.9 82.3 82.8 83.1 80.0
Source: adapted from hadley et al. 12
a the 10 states with dhI records analyzed included five upper Midwest states (Illinois, Indiana, Iowa, Michigan,
and Wisconsin) and five northeast states (Maine, new hampshire, new York, Pennsylvania, and Vermont).
b health removals included those due to udder and mastitis problems, lameness and injury, disease, and repro-
duction problems but not death.