


Page 197 - MAT KS3 Y8 Cambridge CheckPoint
P. 197
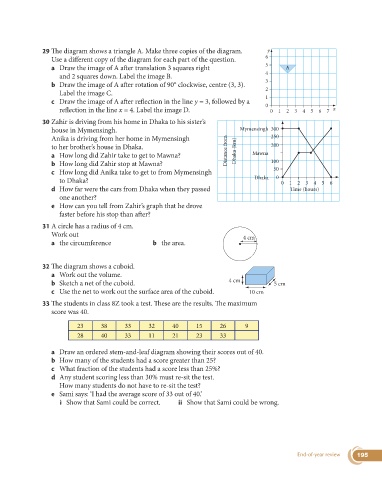
29  The diagram shows a triangle A. Make three copies of the diagram.      y
                  Use a different copy of the diagram for each part of the question.      6
                                                                                          5
                  a   Draw the image of A after translation 3 squares right                     A
                                                                                          4
                     and 2 squares down. Label the image B.
                                                                                          3
                  b   Draw the image of A after rotation of 90° clockwise, centre (3, 3).
                                                                                          2
                     Label the image C.
                                                                                          1
                  c   Draw the image of A after reflection in the line y = 3, followed by a
                                                                                          0
                     reflection in the line x = 4. Label the image D.                      0  1  2  3  4  5  6  7  x
               30  Zahir is driving from his home in Dhaka to his sister’s
                  house in Mymensingh.                                           Mymensingh  300
                  Anika is driving from her home in Mymensingh                             250
                  to her brother’s house in Dhaka.                           Distance from  Dhaka (km)  200
                  a  How long did Zahir take to get to Mawna?                        Mawna
                  b  How long did Zahir stop at Mawna?                                     100
                                                                                            50
                  c   How long did Anika take to get to from Mymensingh
                                                                                      Dhaka  0
                     to Dhaka?                                                                 0  1  2  3  4  5  6
                  d   How far were the cars from Dhaka when they passed                           Time (hours)
                     one another?
                  e   How can you tell from Zahir’s graph that he drove
                     faster before his stop than after?
               31 A circle has a radius of 4 cm.
                    Work out
                                                                                  4 cm
                  a  the circumference              b the area.


               32 The diagram shows a cuboid.
                  a  Work out the volume.
                                                                             4 cm
                  b  Sketch a net of the cuboid.                                            5 cm
                  c  Use the net to work out the surface area of the cuboid.        10 cm
               33  The students in class 8Z took a test. These are the results. The maximum
                  score was 40.

                           23      38      33      32      40     15      26       9
                           28      40      33      11      21     23      33


                  a  Draw an ordered stem-and-leaf diagram showing their scores out of 40.
                  b  How many of the students had a score greater than 25?
                  c  What fraction of the students had a score less than 25%?
                  d   Any student scoring less than 30% must re-sit the test.
                     How many students do not have to re-sit the test?
                  e  Sami says: ‘I had the average score of 33 out of 40.’
                     i  Show that Sami could be correct.     ii  Show that Sami could be wrong.


                                                                                                    End-of-year review  195

