


Page 193 - MAT KS3 Y8 Cambridge CheckPoint
P. 193
End-of-unit review


                 End-of-unit review
                                                                               20    Mass of items posted by an internet
                                                                                         company in one week
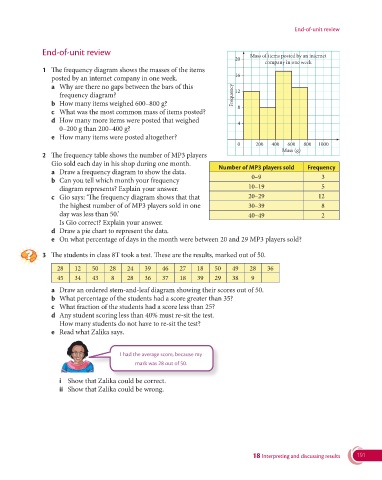
               1   The frequency diagram shows the masses of the items
                  posted by an internet company in one week.                   16
                  a   Why are there no gaps between the bars of this
                     frequency diagram?                                        Frequency  12
                  b  How many items weighed 600–800 g?                          8
                  c  What was the most common mass of items posted?
                  d   How many more items were posted that weighed
                                                                                4
                     0–200 g than 200–400 g?
                  e  How many items were posted altogether?
                                                                                0     200   400  600  800  1000
                                                                                               Mass (g)
               2   The frequency table shows the number of MP3 players
                  Gio sold each day in his shop during one month.         Number of MP3 players sold    Frequency
                  a   Draw a frequency diagram to show the data.
                  b   Can you tell which month your frequency                        0–9                    3
                     diagram represents? Explain your answer.                       10–19                   5
                  c   Gio says: ‘The frequency diagram shows that that              20–29                  12
                     the highest number of of MP3 players sold in one               30–39                   8
                     day was less than 50.’                                         40–49                   2
                    Is Gio correct? Explain your answer.
                  d  Draw a pie chart to represent the data.
                  e  On what percentage of days in the month were between 20 and 29 MP3 players sold?

               3  The students in class 8T took a test. These are the results, marked out of 50.

                    28    12    50    28   24    39    46    27    18    50    49   28    36
                    45    34    43    8    28    36    37    18    39    29    38    9

                  a  Draw an ordered stem-and-leaf diagram showing their scores out of 50.
                  b  What percentage of the students had a score greater than 35?
                  c  What fraction of the students had a score less than 25?
                  d  Any student scoring less than 40% must re-sit the test.
                    How many students do not have to re-sit the test?
                  e  Read what Zalika says.


                                         I had the average score, because my
                                              mark was 28 out of 50.


                     i  Show that Zalika could be correct.
                     ii  Show that Zalika could be wrong.


                                                                                     18 Interpreting and discussing results  191

