


Page 190 - MAT KS3 Y8 Cambridge CheckPoint
P. 190
18.5 Drawing conclusions


               18.5 Drawing conclusions


               So far you have drawn several different types of diagram, chart and graph. You have also read
               information from these diagrams, charts and graphs. It is important that you can also use the
               information you find to draw conclusions and make observations.


                Worked example 18.5

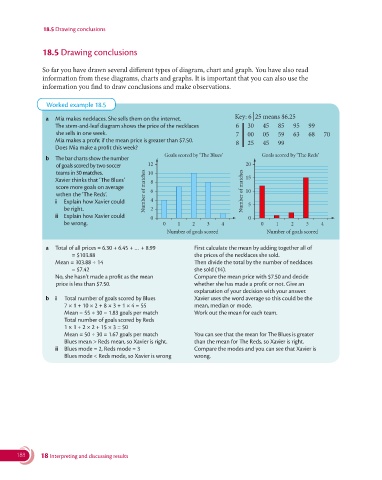
                a  Mia makes necklaces. She sells them on the internet.        Key: 6  25 means $6.25
                   The stem-and-leaf diagram shows the price of the necklaces    6  30   45   85   95   99
                    she sells in one week.                                      7   00   05   59   63   68   70
                   Mia makes a profit if the mean price is greater than $7.50.
                                                                                8   25   45   99
                   Does Mia make a profit this week?
                                                        Goals scored by ‘The Blues’     Goals scored by ‘The Reds’
                b  The bar charts show the number
                    of goals scored by two soccer    12                            20
                    teams in 30 matches.          10
                   Xavier thinks that ‘The Blues’    8                             15
                    score more goals on average    Number of matches  6           Number of matches  10
                    wthen the ‘The Reds’.
                   i   Explain how Xavier could    4                                5
                      be right.                    2
                    ii   Explain how Xavier could    0                              0
                      be wrong.                        0    1    2    3    4            0    1    2    3    4
                                                         Number of goals scored           Number of goals scored

                a  Total of all prices = 6.30 + 6.45 + … + 8.99     First calculate the mean by adding together all of
                         = $103.88                                  the prices of the necklaces she sold.
                   Mean = 103.88 ÷ 14                             Then divide the total by the number of necklaces
                         = $7.42                                  she sold (14).
                    No, she hasn’t made a profit as the mean       Compare the mean price with $7.50 and decide
                    price is less than $7.50.                       whether she has made a profit or not. Give an
                                                                  explanation of your decision with your answer.
                b  i  Total number of goals scored by Blues         Xavier uses the word average so this could be the
                       7 × 1 + 10 × 2 + 8 × 3 + 1 × 4 = 55          mean, median or mode.
                        Mean = 55 ÷ 30 = 1.83 goals per match       Work out the mean for each team.
                        Total number of goals scored by Reds
                       1 × 1 + 2 × 2 + 15 × 3 = 50
                       Mean = 50 ÷ 30 = 1.67 goals per match        You can see that the mean for The Blues is greater
                      Blues mean > Reds mean, so Xavier is right.     than the mean for The Reds, so Xavier is right.
                   ii  Blues mode = 2, Reds mode = 3                Compare the modes and you can see that Xavier is
                      Blues mode < Reds mode, so Xavier is wrong   wrong.


       188     18 Interpreting and discussing results

