


Page 187 - MAT KS3 Y8 Cambridge CheckPoint
P. 187
18.3 Interpreting and drawing line graphs


               ✦     Exercise 18.3                                                           Company profit


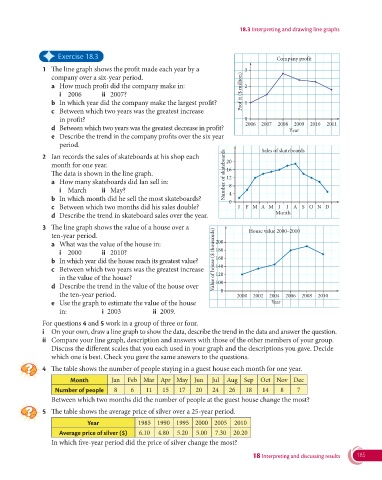
               1   The line graph shows the profit made each year by a
                  company over a six-year period.
                  a  How much profit did the company make in:                     Prof it ($ million) 3 2
                     i  2006       ii 2007?
                  b  In which year did the company make the largest profit?        1
                  c   Between which two years was the greatest increase
                     in profit?                                                    0
                                                                                   2006  2007  2008  2009  2010  2011
                  d   Between which two years was the greatest decrease in profit?                Year
                  e   Describe the trend in the company profits over the six year
                     period.
               2   Ian records the sales of skateboards at his shop each                Sales of skateboards
                  month for one year.                                        20
                  The data is shown in the line graph.                      Number of skateboards  16
                  a  How many skateboards did Ian sell in:                   12
                                                                             8
                     i  March      ii May?                                   4
                  b  In which month did he sell the most skateboards?
                                                                             0
                  c  Between which two months did his sales double?             J  F MAM J       J  A S O N D
                  d  Describe the trend in skateboard sales over the year.                   Month

               3   The line graph shows the value of a house over a                 House value 2000–2010
                  ten-year period.
                  a  What was the value of the house in:                 200
                     i  2000       ii 2010?                              180
                  b  In which year did the house reach its greatest value?  Value of house ($ thousands)  160
                  c   Between which two years was the greatest increase   140
                     in the value of the house?                          120
                  d   Describe the trend in the value of the house over   100
                     the ten-year period.                                  0    2000  2002  2004  2006  2008  2010
                  e   Use the graph to estimate the value of the house                      Year
                     in:           i 2003           ii 2009.

                 For questions 4 and 5 work in a group of three or four.
               i   On your own, draw a line graph to show the data, describe the trend in the data and answer the question.
               ii   Compare your line graph, description and answers with those of the other members of your group.
                    Discuss the different scales that you each used in your graph and the descriptions you gave. Decide
                  which one is best. Check you gave the same answers to the questions.
               4  The table shows the number of people staying in a guest house each month for one year.

                        Month         Jan   Feb Mar Apr May Jun         Jul  Aug Sep    Oct Nov Dec
                   Number of people    8     6    11   15    17   20    24   26    18    14    8    7
                  Between which two months did the number of people at the guest house change the most?
               5  The table shows the average price of silver over a 25-year period.

                              Year             1985 1990 1995 2000 2005        2010
                     Average price of silver ($)  6.10  4.80  5.20  5.00  7.30  20.20
                  In which five-year period did the price of silver change the most?
                                                                                     18 Interpreting and discussing results  185

