


Page 183 - MAT KS3 Y8 Cambridge CheckPoint
P. 183
18.1 Interpreting and drawing frequency diagrams


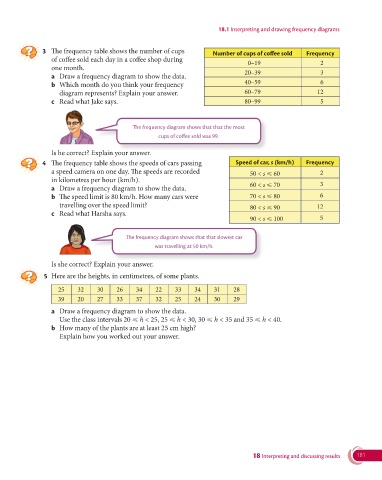
               3   The frequency table shows the number of cups         Number of cups of coffee sold   Frequency
                  of coffee sold each day in a coffee shop during                   0–19                    2
                  one month.
                  a  Draw a frequency diagram to show the data.                    20–39                    3
                  b   Which month do you think your frequency                      40–59                    6
                     diagram represents? Explain your answer.                      60–79                   12
                  c   Read what Jake says.                                         80–99                    5


                                             The frequency diagram shows that that the most
                                                      cups of coffee sold was 99.

                  Is he correct? Explain your answer.
               4   The frequency table shows the speeds of cars passing         Speed of car, s (km/h)  Frequency
                  a speed camera on one day. The speeds are recorded                50 < s ⩽ 60             2
                  in kilometres per hour (km/h).
                                                                                    60 < s ⩽ 70             3
                  a  Draw a frequency diagram to show the data.
                  b   The speed limit is 80 km/h. How many cars were                70 < s ⩽ 80             6
                     travelling over the speed limit?                               80 < s ⩽ 90            12
                  c  Read what Harsha says.
                                                                                    90 < s ⩽ 100            5


                                           The frequency diagram shows that that slowest car
                                                     was travelling at 50 km/h.

                  Is she correct? Explain your answer.

                5  Here are the heights, in centimetres, of some plants.

                    25     32    30     26    34     22    33     34    31     28
                    39     20    27     33    37     32    25     24    30     29
                  a  Draw a frequency diagram to show the data.
                    Use the class intervals 20 ⩽ h < 25, 25 ⩽ h < 30, 30 ⩽ h < 35 and 35 ⩽ h < 40.
                  b  How many of the plants are at least 25 cm high?
                    Explain how you worked out your answer.


                                                                                     18 Interpreting and discussing results  181

