


Page 188 - MAT KS3 Y8 Cambridge CheckPoint
P. 188
18.4 Interpreting and drawing stem-and-leaf diagrams


               18.4 Interpreting and drawing stem-and-leaf diagrams


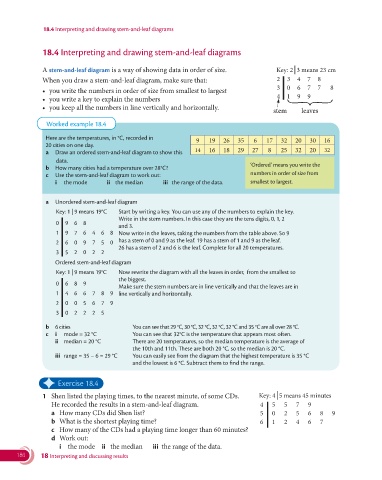
               A stem-and-leaf diagram is a way of showing data in order of size.            Key: 2  3 means 23 cm
               When you draw a stem-and-leaf diagram, make sure that:                        2   3  4   7  8
                                                                                             3   0  6   7  7   8
               r  you write the numbers in order of size from smallest to largest
               r  you write a key to explain the numbers                                     4   1  9   9
               r  you keep all the numbers in line vertically and horizontally.
                                                                                            stem      leaves
                Worked example 18.4

                  Here are the temperatures, in °C, recorded in    9   19   26  35    6   17   32   20  30   16
                20 cities on one day.
                                                                  14   16   18  29   27    8   25   32  20   32
                a  Draw an ordered stem-and-leaf diagram to show this
                    data.
                                                                                     ‘Ordered’ means you write the
                b  How many cities had a temperature over 28°C?
                c  Use the stem-and-leaf diagram to work out:                        numbers in order of size from
                    i  the mode      ii the median     iii  the range of the data.   smallest to largest.


                a  Unordered stem-and-leaf diagram
                    Key: 1 | 9 means 19°C    Start by writing a key. You can use any of the numbers to explain the key.
                                           Write in the stem numbers. In this case they are the tens digits, 0, 1, 2
                    0  968
                                         and 3.
                    1  976468              Now write in the leaves, taking the numbers from the table above. So 9
                                         has a stem of 0 and 9 as the leaf. 19 has a stem of 1 and 9 as the leaf.
                    2  609750
                                           26 has a stem of 2 and 6 is the leaf. Complete for all 20 temperatures.
                    3  52022
                   Ordered stem-and-leaf diagram
                    Key: 1 | 9 means 19°C    Now rewrite the diagram with all the leaves in order,  from the smallest to
                                           the biggest.
                    0  689
                                           Make sure the stem numbers are in line vertically and that the leaves are in
                    1  466789              line vertically and horizontally.
                    2  005679

                    3  02225

                b  6 cities                    You can see that 29 °C, 30 °C, 32 °C, 32 °C, 32 °C and 35 °C are all over 28 °C.
                c  i  mode = 32 °C             You can see that 32°C is the temperature that appears most often.
                   ii  median = 20 °C          There are 20 temperatures, so the median temperature is the average of
                                             the 10th and 11th. These are both 20 °C, so the median is 20 °C.
                   iii  range = 35 − 6 = 29 °C     You can easily see from the diagram that the highest temperature is 35 °C
                                             and the lowest is 6 °C. Subtract them to find the range.

               ✦     Exercise 18.4


               1   Shen listed the playing times, to the nearest minute, of some CDs.    Key: 4  5 means 45 minutes
                  He recorded the results in a stem-and-leaf diagram.                   4   5   5   7   9
                  a  How many CDs did Shen list?                                        5   0   2   5   6   8   9
                  b  What is the shortest playing time?                                 6   1   2   4   6   7
                  c   How many of the CDs had a playing time longer than 60 minutes?
                  d  Work out:
                     i  the mode  ii the median     iii  the range of the data.
       186     18 Interpreting and discussing results

