


Page 191 - MAT KS3 Y8 Cambridge CheckPoint
P. 191
18.5 Drawing conclusions


               ✦     Exercise 18.5


               1  Mr Lopez makes pottery vases. He sells them on the internet.   Key: 24  20 means $24.20
                    The stem-and-leaf diagram shows the prices of the vases he    24  20  33  79  80  90
                  sells in one week.                                             25  05  25   50  70  70   99  99
                    Mr Lopez makes a profit if the mean price is greater         26  40  45   60  65  90
                  than $25.50.
                  Does Mr Lopez make a profit this week?
                  Show your working.

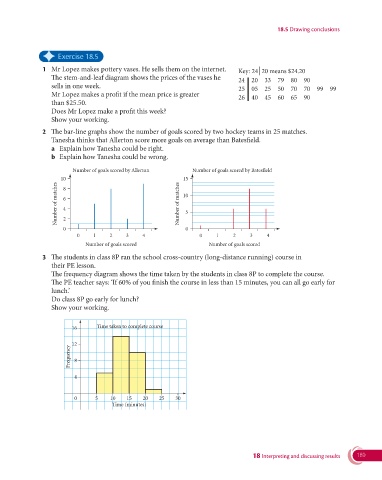
               2   The bar-line graphs show the number of goals scored by two hockey teams in 25 matches.
                    Tanesha thinks that Allerton score more goals on average than Batesfield.
                  a   Explain how Tanesha could be right.
                  b   Explain how Tanesha could be wrong.

                         Number of goals scored by Allerton      Number of goals scored by Batesfield
                     10 8                                     15
                    Number of matches  6 4                   Number of matches  10 5


                      0 2                                      0
                           0    1     2    3     4                  0    1     2    3     4
                              Number of goals scored                   Number of goals scored

               3   The students in class 8P ran the school cross-country (long-distance running) course in
                  their PE lesson.
                    The frequency diagram shows the time taken by the students in class 8P to complete the course.
                    The PE teacher says: ‘If 60% of you finish the course in less than 15 minutes, you can all go early for
                  lunch.’
                  Do class 8P go early for lunch?
                  Show your working.


                         16      Time taken to complete course

                         12
                        Frequency  8


                          4


                          0      5    10   15    20   25    30
                                      Time (minutes)


                                                                                     18 Interpreting and discussing results  189

