


Page 189 - MAT KS3 Y8 Cambridge CheckPoint
P. 189
18.4 Interpreting and drawing stem-and-leaf diagrams


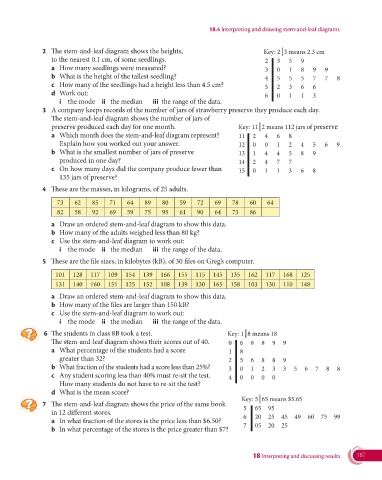
               2   The stem-and-leaf diagram shows the heights,                          Key: 2  3 means 2.3 cm
                  to the nearest 0.1 cm, of some seedlings.                              2   3   5   9
                  a  How many seedlings were measured?                                   3   0   1   8   9   9
                  b  What is the height of the tallest seedling?                         4   5   5   5   7   7   8
                  c  How many of the seedlings had a height less than 4.5 cm?            5   2   3   6   6
                  d  Work out:                                                           6   0   1   1   3
                     i  the mode  ii the median     iii  the range of the data.
               3  A company keeps records of the number of jars of strawberry preserve they produce each day.
                    The stem-and-leaf diagram shows the number of jars of
                  preserve produced each day for one month.                      Key: 11  2 means 112 jars of preserve
                  a  Which month does the stem-and-leaf diagram represent?       11  2   4   6   8
                    Explain how you worked out your answer.                      12  0   0   1   2   4   5   6   9
                  b   What is the smallest number of jars of preserve            13  1   4   4   5   8   9
                     produced in one day?                                        14  2   4   7   7
                  c   On how many days did the company produce fewer than        15  0   1   1   3   6   8
                     135 jars of preserve?

               4  These are the masses, in kilograms, of 25 adults.

                    73    62    85    71   64    89    80    59    72    69    78   60    64
                    82    58    92    69   59    75    95    61    90    64    73   86
                  a  Draw an ordered stem-and-leaf diagram to show this data.
                  b  How many of the adults weighed less than 80 kg?
                  c  Use the stem-and-leaf diagram to work out:
                     i  the mode  ii the median     iii  the range of the data.

               5  These are the file sizes, in kilobytes (kB), of 30 files on Greg’s computer.

                    101  128   117   109   154   139   166  155   115   145   135   162   117   168  125
                    131  140   160   151   125   152   108  139   130   165   158   103   130   110  148
                  a  Draw an ordered stem-and-leaf diagram to show this data.
                  b  How many of the files are larger than 150 kB?
                  c  Use the stem-and-leaf diagram to work out:
                     i  the mode  ii the median     iii  the range of the data.

                6  The students in class 8B took a test.                     Key: 1  8 means 18
                    The stem-and-leaf diagram shows their scores out of 40.  0   6   8  8   9   9
                  a   What percentage of the students had a score            1   8
                     greater than 32?                                        2   5   6  8   8   9
                  b   What fraction of the students had a score less than 25%?  3  0  1  2  3   3  5   6  7   8   8
                  c  Any student scoring less than 40% must re-sit the test.  4  0   0  0   0
                    How many students do not have to re-sit the test?
                  d  What is the mean score?
                                                                                  Key: 5  65 means $5.65
               7   The stem-and-leaf diagram shows the price of the same book
                                                                                  5   65   95
                  in 12 different stores.
                                                                                  6   20   25  45  49   60  75   99
                  a  In what fraction of the stores is the price less than $6.50?
                                                                                  7   05   20  25
                  b  In what percentage of the stores is the price greater than $7?


                                                                                     18 Interpreting and discussing results  187

