
Page 7 - Real Life Annual Report 2021
P. 7
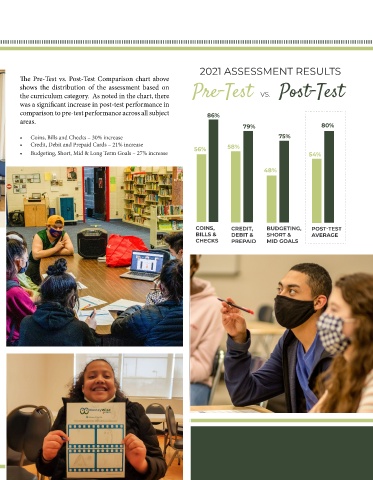
2021 ASSESSMENT RESULTS
        The Pre-Test vs. Post-Test Comparison chart above
        shows the distribution of the assessment based on         Pre-Test  VS. Post-Test
        the curriculum category.  As noted in the chart, there
        was a significant increase in post-test performance in
        comparison to pre-test performance across all subject          86%
        areas.
                                                                                   79%                        80%
        •   Coins, Bills and Checks – 30% increase                                             75%
        •   Credit, Debit and Prepaid Cards – 21% increase                    58%
        •   Budgeting, Short, Mid & Long Term Goals – 27% increase  56%                                  54%

                                                                                          48%


                                                                   COINS,      CREDIT,     BUDGETING,     POST-TEST
                                                                   BILLS &     DEBIT &     SHORT &        AVERAGE
                                                                   CHECKS      PREPAID     MID GOALS


                                                                                                                   07