
Page 318 - Nutrition Counseling and Education Skills: A Guide for Professionals
P. 318
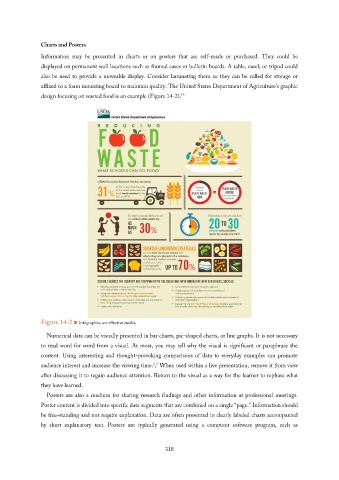
Charts and Posters
Information may be presented in charts or on posters that are self-made or purchased. They could be
displayed on permanent wall locations such as framed cases or bulletin boards. A table, easel, or tripod could
also be used to provide a moveable display. Consider laminating them so they can be rolled for storage or
affixed to a foam mounting board to maintain quality. The United States Department of Agriculture’s graphic
design focusing on wasted food is an example (Figure 14-2).13

Figure 14-2 ■ Infographics are effective media.

   Numerical data can be visually presented in bar charts, pie-shaped charts, or line graphs. It is not necessary
to read word for word from a visual. At most, you may tell why the visual is significant or paraphrase the
content. Using interesting and thought-provoking comparisons of data to everyday examples can promote
audience interest and increase the viewing time.3,5 When used within a live presentation, remove it from view
after discussing it to regain audience attention. Return to the visual as a way for the learner to rephase what
they have learned.

   Posters are also a medium for sharing research findings and other information at professional meetings.
Poster content is divided into specific data segments that are combined on a single “page.” Information should
be free-standing and not require explanation. Data are often presented in clearly labeled charts accompanied
by short explanatory text. Posters are typically generated using a computer software program, such as

                                                                318