
Page 2 - POSTER FYP MAC-OGOS 2025
P. 2
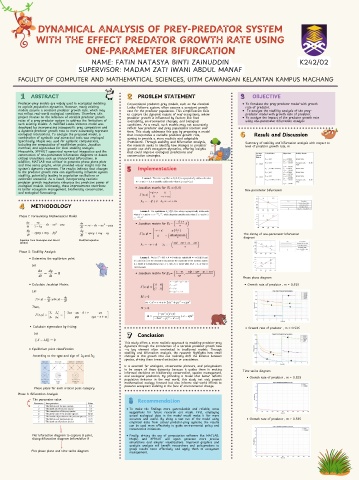
DYNAMICAL ANALYSIS OF PREY-PREDATOR SYSTEM
WITH THE EFFECT PREDATOR GROWTH RATE USING
ONE-PARAMETER BIFURCATION
NAME: FATIN NATASYA BINTI ZAINUDDIN K242/02
SUPERVISOR: MADAM ZATI IWANI ABDUL MANAF
FACULTY OF COMPUTER AND MATHEMATICAL SCIENCES, UITM CAWANGAN KELANTAN KAMPUS MACHANG
ABSTRACT PROBLEM STATEMENT OBJECTIVE
Predator-prey models are widely used in ecological modeling Conventional predator-prey models, such as the classical To fomulate the prey-predator model with growth
to explain population dynamics. However, many existing Lotka-Volterra system, often assume a constant growth rate of predator.
models assume a constant predator growth rate, which may rate for the predator population. This simplification fails To analyze the stability analysis of the prey-
not reflect real-world ecological conditions. Therefore, this to capture the dynamic nature of real ecosystems, where predator model with growth rate of predator.
project focuses on the influence of variable predator growth predator growth is influenced by factors like food To analyze the impact of the predator growth rate
rates of a prey-predator system to address the limitations of availability, environmental changes, and biological using one-parameter bifurcation analysis
such existing models. A modified Lotka-Volterra model was conditions. As a result, such models may not accurately
developed by incorporating intraspecific prey competition and reflect how predator and prey populations interact over
a dynamic predator growth rate to more accurately represent time. This study addresses this gap by proposing a model
ecological interactions. To analyze the proposed model, a that incorporates a variable predator growth rate, Result and Discussion
combination of symbolic and numerical tools was employed. aiming to provide a more realistic and adaptable
Specifically, Maple was used for symbolic computations, framework. Through stability and bifurcation analysis,
including the computation of equilibrium points, Jacobian the research seeks to identify how changes in predator Summary of stability and bifurcation analysis with respect to
level of predator growth rate, m
matrices, and eigenvalues for local stability analysis. growth can shift ecosystem dynamics, offering insights
Meanwhile, XPPAUT supported numerical integration and the that could improve ecological predictions and
construction of one-parameter bifurcation diagrams to detect conservation strategies.
critical transitions such as transcritical bifurcations. In
addition, MATLAB was utilized to generate phase plane plots
and time series graphs, which provided visual insight into the
system’s dynamic responses. The results indicate that changes Implementation
in the predator growth rate can significantly influence system
stability, potentially leading to population oscillations or
extinction scenarios. As a result, incorporating realistic
predator growth mechanisms enhances the predictive power of
ecological models. Ultimately, these improvements contribute
Jacobian matrix for
to better ecosystem management, biodiversity conservation, One-parameter bifurcation
and ecological forecasting.
METHODOLOGY
Phase 1: Formulating Mathematical Model
Jacobian matrix for
The slicing of one-parameter bifurcation
diagram
Equation from Mustapha and Nazrri Modified equation
(2023)
Phase 2: Stability Analysis
Determine the equlibrium point
Let
Jacobian matrix for
Phase plane diagram
Calculate Jacobian Matrix Growth rate of predator , m = 0.525
Let
Then,
Calculate eigenvalues by letting:
Growth rate of predator , m = 0.535
Let
Conclusion
This study offers a more realistic approach to modeling predator-prey
dynamics through the introduction of a variable predator growth rate
Equilibrium point classification —a key element often overlooked in traditional models. Through
stability and bifurcation analysis, the research highlights how small
According to the type and sign of and changes in this growth rate can radically shift the balance between
species, driving them toward extinction or coexistence.
It is essential for ecologists, conservation planners, and policymakers
to be aware of these dynamics because it guides them in making
Time series diagram
informed decisions on biodiversity conservation, species management,
and ecological prediction. By providing a model that better reflects
Growth rate of predator , m = 0.525
population behavior in the real world, this study not only propels
mathematical ecology forward but also informs real-world efforts to
preserve ecosystem stability in the face of environmental change.
Phase plane for each critical point category
Phase 3: Bifurcation Analysis
The parameter value
Recommendation
To make the findings more generalizable and reliable, some
suggestions for future research are made. First, employing
actual ecological data in the model would make it far more
accurate and useful. By doing a test run of the model using Growth rate of predator , m = 0.535
empirical data from actual predator-prey systems, the results
can be used more effectively to guide environmental policy and
conservation initiatives.
Plot bifurcation diagram to capture B point, Finally, driving the use of computation software like MATLAB,
slicing bifurcation diagram before/after B Maple, and XPPAUT will again generate more precise
simulations and simpler visualizations. Improved graphics and
analytic analysis will benefit researchers and policymakers to
grasp results more effectively and apply them to ecosystem
Plot phase plane and time series diagram
management.