Page 3 - POSTER FYP MAC-OGOS 2025
P. 3

01      ABSTRACT
              FACULTY OF COMPUTER AND MATHEMATICAL SCIENCES, UITM CAWANGAN
                              KELANTAN KAMPUS MACHANG
   K242/03
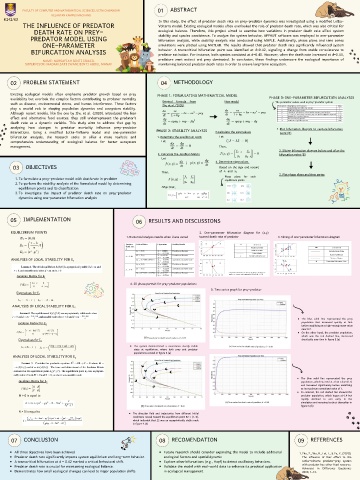
                                                                                           In this study, the effect of predator death rate on prey-predator dynamics was investigated using a modified Lotka-
              THE INFLUENCE OF PREDATOR                                                    Volterra model. Existing ecological models often overlooked the role of predator death rate, which was also critical for

                    DEATH RATE ON PREY-                                                    ecological  balance.  Therefore,  this  project  aimed  to  examine  how  variations  in  predator  death  rate  affect  system
                  PREDATOR MODEL USING                                                     stability and species coexistence. To analyze the system behavior, XPPAUT software was employed to one-parameter
                                                                                           bifurcation  analysis,  while  stability  analysis  was  conducted  using  MAPLE.  Additionally,  phase  plane  and  time  series
                         ONE-PARAMETER                                                     simulations were plotted using MATLAB. The results showed that predator death rate significantly influenced system
                   BIFURCATION ANALYSIS                                                    behavior.  A  transcritical  bifurcation  point  was  identified  at  d=0.42,  signaling  a  change  from  stable  co-existence  to
                                                                                           predator extinction. For instance, both species coexisted at d=0.40. However, when the death rate increased at d=0.44,
                                                                                           predators  went  extinct  and  prey  dominated.  In  conclusion,  these  findings  underscore  the  ecological  importance  of
                         NAME: NORSAFIAH BINTI ISMAIL
               SUPERVISOR: MADAM ZATI IWANI BINTI ABDUL MANAF                              maintaining balanced predator death rates in order to ensure long-term ecosystem.


       02     PROBLEM STATEMENT                                                             04     METHODOLOGY


       Existing  ecological  models  often  emphasize  predator  growth  based  on  prey  PHASE 1: FORMULATING MATHEMATICAL MODEL
       availability but overlook the complex factors contributing to predator mortality                                                                   PHASE 3: 0NE-PARAMETER BIFURCATION ANALYSIS
                                                                                             Original  formula  from            New model                    The parameter values used in prey-predator system
       such  as  disease,  environmental  stress,  and  human  interference.  These  factors
                                                                                             Zhu et al. (2020)
       play  a  crucial  role  in  shaping  population  dynamics  and  ecosystem  stability.
       Although recent models, like the one by Zhu et al. (2020), introduced the fear
       effect  and  alternative  food  sources,  they  still  underrepresent  the  predator's
       death  rate  as  a  dynamic  variable.  This  study  aims  to  address  that  gap  by
       analyzing  how  changes  in  predator  mortality  influence  prey-predator                                                                             1.Plot bifurcation diagram to capture bifurcation
       interactions.  Using  a  modified  Lotka-Volterra  model  and  one-parameter       PHASE 2: STABILITY ANALYSIS      3.Calculate the eigenvalues          point (B)
       bifurcation  analysis,  the  research  seeks  to  offer  a  more  realistic  and   1.Determine the equilibrium point   Let
       comprehensive  understanding  of  ecological  balance  for  better  ecosystem         Let
       management.                                                                                                           Then,
                                                                                                                                                               2. Slicing bifurcation diagram before and after the
                                                                                           2. Calculate the Jacobian Matrix                                    bifurcation point (B)
                                                                                             Let
                                                                                                          ;                4. Determine eigenvalues
        03      OBJECTIVES                                                                                                   Based on the sign and nature
                                                                                             Then,                           of       and
                                                                                                                                                               3. Plot phase plane and time series
                                                                                                                                 Phase  plane  for  each
          1.To formulate a prey-predator model with death rate in predator
                                                                                                                                 equilibrium points
          2.To perform the stability analysis of the formulated model by determining
            equilibrium points and its classification                                        After that,
          3.To  investigate  the  impact  of  predator  death  rate  on  prey-predator
            dynamics using one-parameter bifurcation analysis


       05     IMPLEMENTATION                                                  06     RESULTS AND DISCUSSIONS


       EQUILIBRIUM POINTS                                                                                         2.  One-parameter  bifurcation  diagram  for  (x,y)
                                                                         1.Numerical analysis results when d was varied  toward death rate of predator         3. Slicing of one-parameter bifurcation diagram


       ANALYSIS OF LOCAL STABILITY FOR E
                                           1


          Jacobian Matrix for E 1
                                                                           4. 2D phase portrait for prey-predator populations
                                                                                                                         5. Time series graph for prey-predator
          Eigenvalues for E 1
                    ;
        ANALYSIS OF LOCAL STABILITY FOR E
                                           2


                                                                                                                                                                            The  blue  solid  line  represented  the  prey
                                                                                                                                                                            population  that  increased  quickly  at  first
           Jacobian Matrix for E 2
                                                                                                                                                                            before stabilizing at a high-steady state value
                                                                                                                                                                            near 0.7.
                                                                                                                                                                            On the other hand, the predator population,
                                                                                                                                                                            which  was  the  red  dashed  line,  decreased
                                                                                                                                                                            drastically over time in figure 5.(a)
            Eigenvalues for E 2
                     ;                                                       The  system  demonstrated  a  coexistence  steady  stable
                                                                             state  at  equilibrium,  where  both  prey  and  predator
                                                                             populations existed in figure 4.(a)
        ANALYSIS OF LOCAL STABILITY FOR E
                                            3


                                                                                                                                                                            The  blue  solid  line  represented  the  prey
            Jacobian Matrix for E 3                                                                                                                                         population, which started at a low value (0.1)
                                                                                                                                                                            and  increased  significantly  before  stabilizing
                                                                                                                                                                            at its maximum normalized value of 1.
                                                                                                                                                                            In contrast, the red dashed line showed the
            M > 0 is equal to                                                                                                                                               predator population, which began at 0.4 but
                                                                                                                                                                            rapidly  declined  to  zero  early  in  the
                                                                                                                                                                            simulation and remained extinct thereafter in
                                                                                                                                                                            figure 5.(b)
            N > 0 is equal to
                                                                            The  direction  field  and  trajectories  from  different  initial
                                                                            conditions moved toward the equilibrium point E2 = (1, 0),
                                                                            which indicated that E2 was an asymptotically stable node
                                                                            in figure 4.(b)


       07      CONCLUSION                                                                  08     RECOMENDATION                                                           09     REFERENCES


         All three objectives have been achieved                                              Future research should consider expanding the model to include additional    1.Zhu, Z., Wu, R., Lai, L., & Yu, X. (2020).
         Predator death rate significantly impacts system equilibrium and long-term behavior.  ecological factors and spatial dynamic                                       The  influence  of  fear  effect  to  the
         A transcritical bifurcation at d = 0.42 marked a critical behavioral shift.          Explore other bifurcations (e.g., Hopf) to detect oscillatory behaviors.      Lotka-Volterra  predator-prey  system
                                                                                                                                                                            with predator has other food resource.
         Predator death rate is crucial for maintaining ecological balance.                   Validate the model with real-world data to enhance its practical application
                                                                                                                                                                            Advances  in  Difference  Equations,
         Demonstrates how small ecological changes can lead to major population shifts.       in ecological management.                                                     2020, 1–13.
   1   2   3   4   5   6   7   8