
Page 6 - POSTER FYP MAC-OGOS 2025
P. 6
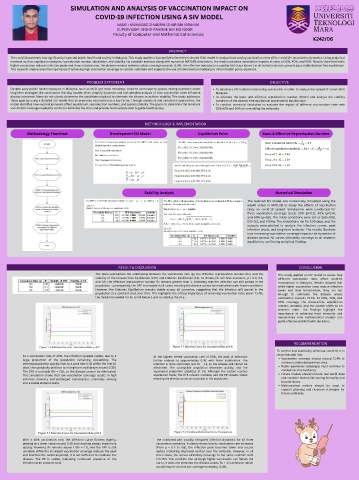
SIMULATION AND ANALYSIS OF VACCINATION IMPACT ON
COVID-19 INFECTION USING A SIV MODEL
NAME : MUHAMAD ZHAKIRIN IZHAR BIN IBRAHIM
SUPERVISOR : MOHD RAHIMIE BIN MD NOOR
Faculty of Computer and Mathematical Sciences
K242/06
ABSTRACT
The covid-19 pandemic has significantly impacted public health and society in Malaysia. This study applies a Susceptible-Infected-Vaccinated (SIV) model to analyze how varying vaccination rates affect covid-19 transmission dynamics. Using analytical
methods such as equilibrium analysis, reproduction number calculation, and stability via Jacobian matrices along with numerical MATLAB simulations, the model evaluates vaccination impacts at rates of 20%, 40%, and 60%. Results show that while
higher vaccination reduces infection peaks and slows transmission, the disease remains endemic unless coverage exceeds 71.4%. The effective reproduction number (Rv) stays above 1 in all tested scenarios, preventing a stable disease-free equilibrium.
This research underscores the importance of achieving high vaccination coverage to contain outbreaks and supports the use of mathematical modeling to inform health policy decisions.
PROBLEM STATEMENT OBJECTIVE
Despite early public health measures in Malaysia, such as MCO and mask mandates, covid-19 continued to spread, raising questions about To develop a SIV model incorporating vaccination in order to analyze the spread of covid--19 in
long-term strategies like vaccination. Existing models often simplify dynamics and lack detailed analysis of how vaccination rates influence Malaysia.
disease outcomes. Many do not clearly determine the conditions required to eliminate the disease or achieve stability. This study addresses To estimate the basic and effective reproduction number (R0,Rv) and analyze the stability
these gaps by using a detailed SIV model that incorporates vaccination as a key factor. Through analytical and simulation approaches, the condition of the disease-free equilibrium and endemic equiliborium.
model identifies how vaccination levels affect equilibrium, reproduction numbers, and system stability. The goal is to determine the minimum To conduct numerical simulation to evaluate the impact of different vaccionation rates with
vaccination coverage needed to control or eliminate the virus and provide more reliable data to guide health policy. 20%,40% and 60% on controlling the outbreaks.
METHODOLOGY & IMPLEMENTATION
Methodology Flowchart Devolepment SIV Model Equilibrium Point Basic & Effective Reproduction Number
Stability Analysis Numerical Simulation
The reduced SIV model was numerically simulated using the
ode45 solver in MATLAB to study the effects of vaccination
rates on covid-19 spread. Simulations were conducted for
three vaccination coverage levels: 20% (p=0.2), 40% (p=0.4),
and 60% (p=0.6). The initial conditions were set as S(0)=0.65,
I(0)=0.1, and V(0)=p. The simulations ran for 100 days, and the
outputs were plotted to analyze the infection curves, peak
infection levels, and long-term behavior. The results illustrate
how increasing vaccination coverage impacts the dynamics of
disease spread. All curves ultimately converge to an endemic
equilibrium, confirming analytical findings.
RESULT & DISCUSSION CONCLUSION
The table summarizes the relationship between the vaccination rate (p), the effective reproduction number (Rv), and the This study applied an SIV model to assess how
stability of the Disease-Free Equilibrium (DFE) and Endemic Equilibrium (EE). As shown, for all three scenarios ,p = 0.2, 0.4, different vaccination rates affect covid-19
and 0.6, the effective reproduction number Rv remains greater than 1, indicating that the infection can still spread in the transmission in Malaysia. Results showed that
population. Consequently, the DFE is unstable in all cases, meaning the disease cannot be eradicated under these conditions. while higher vaccination rates reduce infection
However, the Endemic Equilibrium remains stable across all scenarios, suggesting that the infection will persist in the peaks and slow transmission, they are not
population at a constant level over time. This highlights the critical importance of achieving vaccination rates above 71.4%, enough to eliminate the disease unless
the threshold needed for Rv to fall below 1 and to stabilize the DFE. vaccination exceeds 71.4%. At 20%, 40%, and
60% coverage, the disease-free equilibrium
remains unstable, and the system shifts to an
endemic state. The findings highlight the
importance of achieving herd immunity and
demonstrate how mathematical models can
guide effective public health decisions.
RECOMMENDATION
To control and eventually eliminate covid-19, it is
At a vaccination rate of 20%, the infection spreads rapidly due to a At the highest tested vaccination rate of 60%, the peak of infections recommended that:
large proportion of the population remaining susceptible. The further reduces to approximately 0.36, with faster stabilization. The Vaccination coverage should exceed 71.4% to
infected population quickly rises to a peak near 0.42 within the first 10 infection is more controlled, but Rv = 1.4, so the disease still cannot be achieve a stable disease-free state.
days, then gradually declines to a long-term equilibrium around 0.357. eliminated. The susceptible population decreases quickly, and the Public awareness campaigns must continue to
The DFE is unstable (Rv = 2.8), so the disease cannot be eliminated. vaccinated proportion stabilizes at 0.6. Although the system reaches combat vaccine hesitancy.
This simulation shows that low vaccination coverage results in high equilibrium faster, the DFE remains unstable, and the EE remains stable Future models should include real-world data
infection intensity and prolonged transmission, ultimately settling meaning the disease continues to persist in the population. and consider factors like waning immunity and
into a stable endemic state. booster doses.
Mathematical models should be used to
support planning and response strategies for
future outbreaks.
With a 40% vaccination rate, the infection curve flattens slightly, The combined plot visually compares infection dynamics for all three
peaking at a lower value around 0.35 and reaching steady state more vaccination scenarios. It clearly shows that as vaccination rate increases
quickly. However, Rv remains above 1 (Rv = 2.1), and the DFE is still (from p = 0.2 to 0.6), the infection peak becomes lower and occurs
unstable. While the increased vaccination coverage reduces the peak earlier, indicating improved control over the outbreak. However, in all
and shortens the outbreak period, it is not sufficient to eradicate the three cases, the curves ultimately converge to the same endemic level
disease. The EE is stable, indicating continued presence of the (~0.357). This confirms that although higher vaccination can flatten the
infection at an endemic level. curve, it does not eliminate the disease unless Rv < 1 is achieved which
would require vaccination coverage exceeding 71.4%.