
Page 120 - IGC BOOK
P. 120
The above data can be used to analyse.
Trends–consistent increases or decreases in the number of certain types of events over a period
Patterns–hot-spots of collections of certain types of events.
This analysis usually involves converting raw data (the numbers) into an accident rate so that
more meaningful comparisons can be made.
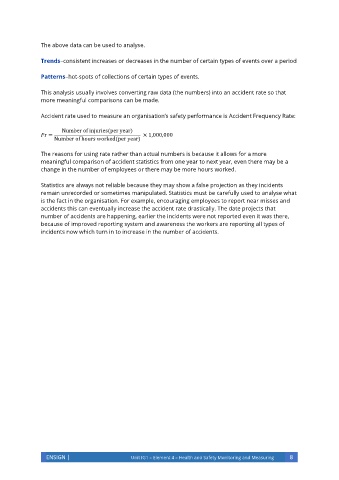
Accident rate used to measure an organisation’s safety performance is Accident Frequency Rate:
Number of injuries(per year)
r = × 1,000,000
Number of hours worked(per year)
The reasons for using rate rather than actual numbers is because it allows for a more
meaningful comparison of accident statistics from one year to next year, even there may be a
change in the number of employees or there may be more hours worked.
Statistics are always not reliable because they may show a false projection as they incidents
remain unrecorded or sometimes manipulated. Statistics must be carefully used to analyse what
is the fact in the organisation. For example, encouraging employees to report near misses and
accidents this can eventually increase the accident rate drastically. The date projects that
number of accidents are happening, earlier the incidents were not reported even it was there,
because of improved reporting system and awareness the workers are reporting all types of
incidents now which turn in to increase in the number of accidents.
ENSIGN | Unit IG1 – Element 4 – Health and Safety Monitoring and Measuring 8