
Page 678 - B2B All Year Round Vol.8
P. 678
DRIVERS OF DEVELOPMENT NEW LIGHT COMMERCIAL VEHICLES AVERAGE
CO EMISSIONS
2
Go Ultra Low on the cost effectiveness of a vehicle as well
as functionality when purchasing a new car.
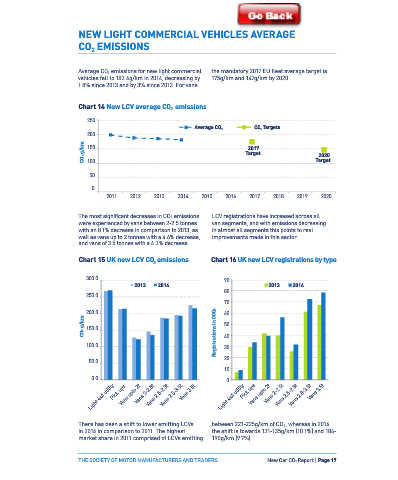
Go Ultra Low, launched in 2014, is a jointly Developing appropriate policies to induce Average CO 2 emissions for new light commercial the mandatory 2017 EU fleet average target is
funded partnership between industry and behavioural change is crucial. The campaign has vehicles fell to 182.4g/km in 2014, decreasing by 175g/km and 147g/km by 2020.
government, including seven OEMs which make already made an impact, encouraging 50% of the 1.8% since 2013 and by 3% since 2012. For vans
up more than 90% of the EV market share, as people who engaged with it to consider buying
well as the Office for Low Emission Vehicles an ULEV, according to independent market
and SMMT. The campaign aims to provide research. It also witnessed that 75% of new car Chart 14 New LCV average CO 2 emissions
information on ultra low emission vehicles to buyers have taken action as a result of seeing
enhance purchase consideration by increasing the campaign, which included seeking out more 250
acceptance and reducing misconceptions of information, speaking to friends or visiting OEM Average CO 2 CO 2 Targets
ULEVs, demonstrating that they are a real websites, as well as a 17% reduction in barriers 200
choice for motorists today. Changes in consumer to purchase (around speed, performance and
behaviour are vital to complement technological cost) and increased understanding of ULEVs 150 2017
advancements and can significantly reduce within target audience. CO 2 g/km Target 2020
CO 2 emissions. Consumers primarily focus 100 Target
European EV Market 50
Europe’s electric vehicle market grew 37% According to ACEA, wider EU-level support 0
in 2014, with the UK experiencing the biggest can help shift the new market focus from 2011 2012 2013 2014 2015 2016 2017 2018 2019 2020
growth of any major market in new plug-in conventional fuel vehicles to electric. It sees
electric vehicles in 2014 . This is largely a result the market share of electric vehicles growing
3
of strong policy incentives and support. Although between 2 and 8% in 2020s but greater The most significant decreases in CO 2 emissions LCV registrations have increased across all
the Netherlands, where significant consumer tax coordination from EU states will be needed. were experienced by vans between 2-2.5 tonnes van segments, and with emissions decreasing
exemptions have been typical, at the end of 2013 Uniform standards for electric vehicle technology with an 8.1% decrease in comparison to 2013, as in almost all segments this points to real
saw government incentives cut. This helps to would also help the process . well as vans up to 2 tonnes with a 4.6% decrease, improvements made in this sector.
4
explain the 42% drop in sales in 2014, compared and vans of 3.5 tonnes with a 4.3% decrease.
to 2013.
Chart 15 UK new LCV CO 2 emissions Chart 16 UK new LCV registrations by type
Chart 13 Total plug-in EVs 2013 – 2014
300.0
UK 300.0 90 90
2013 2014
2013 2014
Sweden 2013 2013 2014 2013 2014
Spain 80 80
250.0
Slovakia 2014 250.0
Romania 70 70
Portugal
200.0
Poland 200.0 60 60
Netherlands
Latvia g/km g/km 50 50
Italy 150.0
Ireland CO 2 CO 2 150.0 Registrations in 000s Registrations in 000s 40 40
Hungary
Greece 100.0 30 30
100.0
Germany
France 20 20
Finland 50.0 50.0
Estonia
Denmark 10 10
Czech Republic 0.0 0.0
Bulgaria 0 0
Vans 3.5t
Light 4x4 utility
Vans 2.5-2.8t
Vans 2.8-3.5t
Vans 2.8-3.5t
Vans 2.8-3.5t
Vans 2.5-2.8t
Vans 2.5-2.8t
Vans 2-2.5t
Pick ups
Vans upto 2t
Vans upto 2t
Light 4x4 utility
Vans 2-2.5t
Pick ups
Vans 3.5t
Belgium
Austria Light 4x4 utility Pick ups Vans upto 2t Vans 2-2.5t Vans 2.5-2.8t Vans 3.5t Light 4x4 utility Pick ups Vans upto 2t Vans 2-2.5t Vans 2.8-3.5t Vans 3.5t
Source: ACEA 0 5,000 10,000 15,000 20,000 25,000
Number of registrations
There has been a shift to lower emitting LCVs between 221-225g/km of CO 2, whereas in 2014
3 Electric vehicle market still not fully charged, ENDS Europe, 5 February 2015 in 2014 in comparison to 2011. The highest the shift is towards 131-135g/km (10.1%) and 186-
4 Ibid market share in 2011 comprised of LCVs emitting 190g/km (9.7%).
Page 16 | New Car CO 2 Report THE SOCIETY OF MOTOR MANUFACTURERS AND TRADERS THE SOCIETY OF MOTOR MANUFACTURERS AND TRADERS New Car CO 2 Report | Page 17