
Page 39 - Insurance Times March 2017 Sample
P. 39
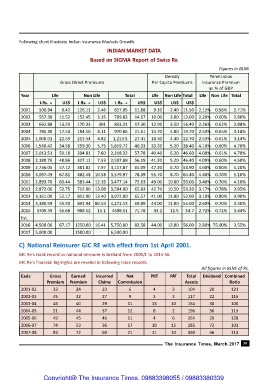
Following chart illustrate Indian Insurance Markets Growth.
                                                 INDIAN MARKET DATA

                                         Based on SIGMA Report of Swiss Re
                                                                                                  Figures in BLNS

                                                                          Density             Penetration
                            Gross Direct Premiums                    Per Capita Premiums   Insurance Premium
                                                                                              as % of GDP
          Year          Life          Non Life           Total      Life  Non Life Total  Life  Non Life Total
                   I.Rs. =   US$    I.Rs. =  US$    I.Rs. =   US$     US$    US$    US$
          2001    500.94    9.42   126.11   2.46    627.05   11.88   9.10    2.40 11.50  2.15%   0.56%   2.71%
          2002    557.38   11.52   152.45   3.15    709.83   14.67  10.00    3.00 13.00  2.20%   0.60%   2.80%
          2003    662.88   13.59   170.33    301    833.21   17.30  12.90    3.50 16.40  2.26%   0.62%   2.88%
          2004    786.30   17.50   184.56   4.11    970.86   21.61  15.70    4.00 19.70  2.53%   0.65%   3.18%
          2005   1,000.01  22.59   213.54   4.82   1,213.5   27.41  18.30    4.40 22.70  2.53%   0.61%   3.14%
          2006   1,560.42  34.58   259.30   5.75  1,819.72   40.33  33.20    5.20 38.40  4.10%   0.60%   4.70%
          2007   2,013.51  50.18   304.81   7.60  2,318.32   57.78  40.40    6.20 46.60  4.09%   0.61%   4.70%
          2008   2,180.76  48.86   327.12   7.33  2,507.88   56.19  41.20    5.20 46.40  4.00%   0.60%   4.60%
          2009   2,736.05  57.12   381.82   7.97  3,117.87   65.09  47.20    6.70 53.90  4.60%   0.60%   5.20%
          2010   3,097.49  67.81   482.48 10.58   3,579.97   78.39  55.70    8.70 64.40  4.40%   0.70%   5.10%
          2011   2,893.70  60.44   583.44 12.19   3,477.14   72.63  49.00   10.00 59.00  3.40%   0.70%   4.10%
          2012   2,872.00  52.75   712.00 13.08   3,584.00   65.83  42.70   10.50 53.20  3.17%   0.78%   3.95%
          2013   3,161.00  52.17   812.00 13.40   3,972.00   65.57  41.00   11.00 52.00  3.10%   0.80%   3.90%
          2014   3,380.59  55.30   891.94 80.59   4,272.53   69.89  44.00   11.00 55.00  2.60%   0.70%   3.30%
          2015   3709.49   56.68   988.52   15.1   4698.51   71.78   43.2    11.5  54.7  2.72%   0.72%   3.44%
          Est.
          2016   4,500.00  67.17  1250.00 16.41   5,750.00   83.58  44.00   12.00 56.00  2.80% 75.00%    3.55%
          2017   5,000.00         1500.00         6,500.00

         C) National Reinsurer GIC RE with effect from 1st April 2001.

         GIC Re's track record as national reinsurer is brilliant from 2000/1 to 2015-16.
         GIC Re's financial highlights are reveled in following track records.
                                                                                           All figures in BLNS of Rs.
          Eads         Gross     Earned     Incurred     Net        PBT      PAT    Total  Dividend Combined
                      Premium   Premium      Claims  Commission                    Assets              Ratio
          2001-02        33        24         23          6          4        3     104       20        121
          2002-03        45        32         27          9          3        3     117       22        116
          2003-04        46        40         29          11         13      10     164       30        100
          2004-05        51        44         37          12         8        2     196       30        113
          2005-06        49        45         46          11         4        6     264       20        128
          2006-07        74        53         36          17         18      15     285       72        101
          2007-08        93        72         60          21         11      10     360       46        113

                                                                          The Insurance Times, March 2017 39


                    Copyright@ The Insurance Times. 09883398055 / 09883380339