
Page 166 - Enzymes in Tropical Soils
P. 166
154 Enzymes In Tropical Soils
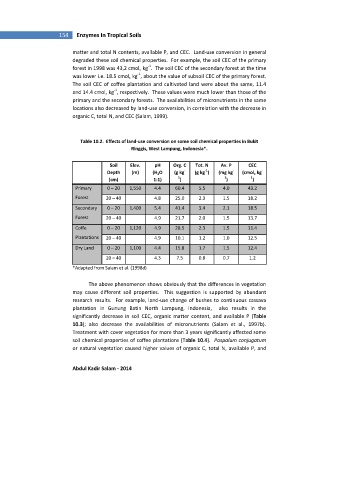
matter and total N contents, available P, and CEC. Land-use conversion in general
degraded these soil chemical properties. For example, the soil CEC of the primary
-1
forest in 1998 was 43,2 cmol c kg . The soil CEC of the secondary forest at the time
-1
was lower i.e. 18.5 cmol c kg , about the value of subsoil CEC of the primary forest.
The soil CEC of coffee plantation and cultivated land were about the same, 11.4
-1
and 14.4 cmol c kg , respectively. These values were much lower than those of the
primary and the secondary forests. The availabilities of micronutrients in the same
locations also decreased by land-use conversion, in correlation with the decrease in
organic C, total N, and CEC (Salam, 1999).
Table 10.2. Effects of land-use conversion on some soil chemical properties in Bukit
Ringgis, West Lampung, Indonesia*.
Soil Elev. pH Org. C Tot. N Av. P CEC
-1
Depth (m) (H 2 O (g kg - (g kg ) (mg kg - (cmol c kg -
(cm) 1:1) 1 ) 1 ) 1 )
Primary 0 – 20 1,550 4.4 60.4 5.5 4.0 43.2
Forest 20 – 40 4.8 25.0 2.3 1.5 18.2
Secondary 0 – 20 1,400 5.4 41.4 3.4 2.1 18.5
Forest 20 – 40 4.9 21.7 2.0 1.5 13.7
Coffe 0 – 20 1,120 4.9 28.5 2.3 1.5 11.4
Plantations 20 – 40 4.9 10.1 1.2 1.0 12.5
Dry Land 0 – 20 1,100 4.4 15.8 1.7 1.5 12.4
20 – 40 4.3 7.5 0.8 0.7 1.2
*Adapted from Salam et al. (1998d)
The above phenomenon shows obviously that the differences in vegetation
may cause different soil properties. This suggestion is supported by abundant
research results. For example, land-use change of bushes to continuous cassava
plantation in Gunung Batin North Lampung, Indonesia, also results in the
significantly decrease in soil CEC, organic matter content, and available P (Table
10.3); also decrease the availabilities of micronutrients (Salam et al., 1997b).
Treatment with cover vegetation for more than 3 years significantly affected some
soil chemical properties of coffee plantations (Table 10.4). Paspalum conjugatum
or natural vegetation caused higher values of organic C, total N, available P, and
Abdul Kadir Salam - 2014