Page 167 - Enzymes in Tropical Soils
P. 167

Enzymes in Tropical Soils   155


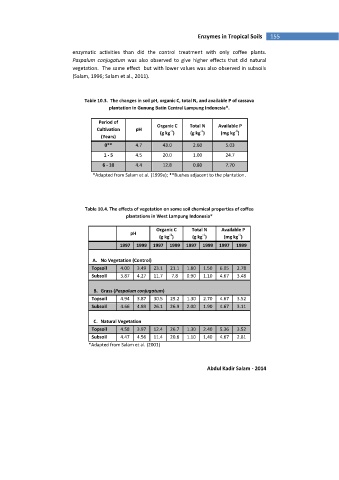
                           enzymatic  activities  than  did  the  control  treatment  with  only  coffee  plants.
                           Paspalum  conjugatum  was  also  observed  to  give  higher  effects  that  did  natural
                           vegetation.  The same effect  but with lower values was also observed in subsoils
                           (Salam, 1996; Salam et al., 2011).


                               Table 10.3.  The changes in soil pH, organic C, total N, and available P of cassava
                                       plantation in Gunung Batin Central Lampung Indonesia*.

                                    Period of
                                                        Organic C   Total N   Available P
                                   Cultivation   pH          -1        -1           -1
                                                         (g kg )    (g kg )    (mg kg )
                                     (Years)
                                      0**        4.7      43.0       2.60       5.03

                                      1 - 5      4.5      20.0       1.00       24.7
                                     6 - 10      4.4      12.8       0.80       7.70
                                  *Adapted from Salam et al. (1999e); **Bushes adjacent to the plantation.


                               Table 10.4. The effects of vegetation on some soil chemical properties of coffee
                                             plantations in West Lampung Indonesia*

                                                        Organic C   Total N    Available P
                                               pH            -1         -1           -1
                                                         (g kg )     (g kg )    (mg kg )
                                           1997  1999  1997  1999  1997  1999  1997   1999

                                  A.  No Vegetation (Control)
                                 Topsoil   4.00   3.49   23.1   21.1   1.80   1.50   6.05   2.78
                                 Subsoil   3.87   4.27   11.7   7.8   0.90   1.10   4.67   3.48

                                  B.  Grass (Paspalum conjugatum)
                                 Topsoil   4.94   3.87   30.5   29.2   1.30   2.70   4.67   3.52
                                 Subsoil   4.66   4.89   26.1   26.9   2.00   1.90   4.67   3.11

                                  C.  Natural Vegetation
                                 Topsoil   4.58   3.97   12.4   26.7   1.30   2.40   5.36   3.52
                                 Subsoil   4.47   4.56   11.4   20.6   1.10   1,40   4.67   2.81
                                *Adapted from Salam et al. (2001)


                                                                          Abdul Kadir Salam - 2014
   162   163   164   165   166   167   168   169   170   171   172