
Page 335 - Ranah Studi Agraria: Penguasaan Tanah dan Hubungan Agraris
P. 335
Ranah Studi Agraria
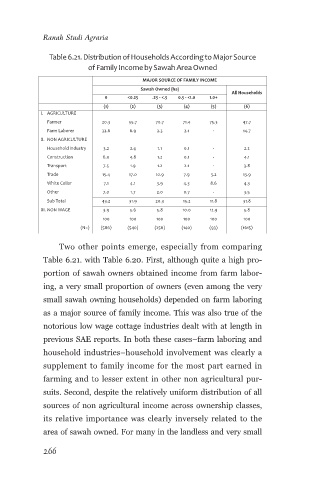
Table 6.21. Distribution of Households According to Major Source
of Family Income by Sawah Area Owned
MAJOR SOURCE OF FAMILY INCOME
Sawah Owned (ha)
All Households
0 <0.25 .25 - <.5 0.5 - <1.0 1.0+
(1) (2) (3) (4) (5) (6)
I. AGRICULTURE
Farmer 20.3 55.7 70.7 71.4 75.3 47.7
Farm Laborer 32.6 6.9 2.3 2.1 - 14.7
II. NON AGRICULTURE
Household industry 3.2 2.4 1.1 0.1 - 2.2
Construction 6.0 4.8 1.2 0.1 - 4.1
Transport 7.5 1.9 1.2 2.1 - 3.8
Trade 15.4 17.0 10.9 7.9 3.2 13.9
White Collar 7.1 4.1 3.9 4.3 8.6 4.3
Other 7.0 1.7 2.0 0.7 - 3.5
Sub Total 43.2 31.9 20.3 15.2 11.8 31.8
III. NON WAGE 3.9 5.6 5.8 10.0 12.9 5.8
100 100 100 100 100 100
(N=) (586) (540) (256) (140) (93) (1615)
Two other points emerge, especially from comparing
Table 6.21. with Table 6.20. First, although quite a high pro-
portion of sawah owners obtained income from farm labor-
ing, a very small proportion of owners (even among the very
small sawah owning households) depended on farm laboring
as a major source of family income. This was also true of the
notorious low wage cottage industries dealt with at length in
previous SAE reports. In both these cases–farm laboring and
household industries–household involvement was clearly a
supplement to family income for the most part earned in
farming and to lesser extent in other non agricultural pur-
suits. Second, despite the relatively uniform distribution of all
sources of non agricultural income across ownership classes,
its relative importance was clearly inversely related to the
area of sawah owned. For many in the landless and very small
266