
Page 340 - Ranah Studi Agraria: Penguasaan Tanah dan Hubungan Agraris
P. 340
Landownership Tenancy, and ...
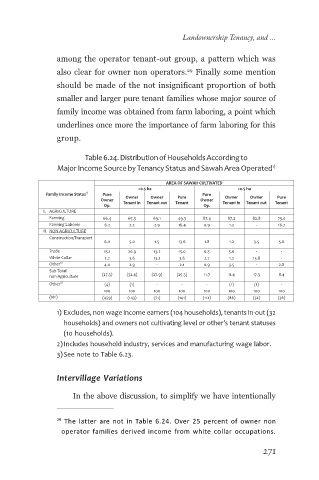
among the operator tenant-out group, a pattern which was
also clear for owner non operators. Finally some mention
29
should be made of the not insignificant proportion of both
smaller and larger pure tenant families whose major source of
family income was obtained from farm laboring, a point which
underlines once more the importance of farm laboring for this
group.
Table 6.24. Distribution of Households According to
Major Income Source by Tenancy Status and Sawah Area Operated 1)
AREA OF SAWAH CULTIVATED
<0.5 ha >0.5 ha
Family Income Status 1) Pure Owner Owner Pure Pure Owner Owner Pure
Owner Tenant in Tenant out Tenant Owner Tenant in Tenant out Tenant
Op. Op.
I. AGRICULTURE
Farming 66.4 65.5 69.1 49.3 87.4 87.2 82.8 75.0
Farming Laborer 6.2 2.2 2.9 16.4 0.9 1.2 - 16.7
II. NON AGRICULTURE
Construction/Transport
6.0 5.0 1.5 13.6 1.8 1.2 3.5 5.6
Trade 15.1 20.9 13.2 15.0 6.3 5.6 - -
White Collar 2.2 3.6 13.2 3.6 2.7 1.2 13.8 -
Other 2) 4.0 2.9 - 2.1 0.9 3.5 - 2.8
Sub Total
non-Agriculture (27.3) (32.4) (27.9) (25.3) 11.7 11.4 17.3 8.4
Other 3) (4) (1) - - - (1) (1) -
100 100 100 100 100 100 100 100
(N=) (459) (143) (71) (141) (112) (86) (32) (36)
1) Excludes, non wage income earners (104 households), tenants in-out (32
households) and owners not cultivating level or other’s tenant statuses
(10 households).
2)Includes household industry, services and manufacturing wage labor.
3)See note to Table 6.23.
Intervillage Variations
In the above discussion, to simplify we have intentionally
29 The latter are not in Table 6.24. Over 25 percent of owner non
operator families derived income from white collar occupations.
271