
Page 338 - Ranah Studi Agraria: Penguasaan Tanah dan Hubungan Agraris
P. 338
Landownership Tenancy, and ...
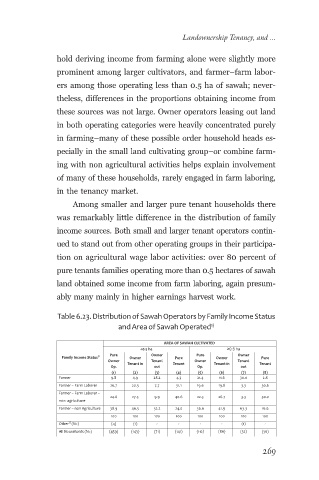
hold deriving income from farming alone were slightly more
prominent among larger cultivators, and farmer–farm labor-
ers among those operating less than 0.5 ha of sawah; never-
theless, differences in the proportions obtaining income from
these sources was not large. Owner operators leasing out land
in both operating categories were heavily concentrated purely
in farming–many of these possible order household heads es-
pecially in the small land cultivating group–or combine farm-
ing with non agricultural activities helps explain involvement
of many of these households, rarely engaged in farm laboring,
in the tenancy market.
Among smaller and larger pure tenant households there
was remarkably little difference in the distribution of family
income sources. Both small and larger tenant operators contin-
ued to stand out from other operating groups in their participa-
tion on agricultural wage labor activities: over 80 percent of
pure tenants families operating more than 0.5 hectares of sawah
land obtained some income from farm laboring, again presum-
ably many mainly in higher earnings harvest work.
Table 6.23. Distribution of Sawah Operators by Family Income Status
and Area of Sawah Operated 1)
AREA OF SAWAH CULTIVATED
<0.5 ha ≥0.5 ha
Family Income Status 1) Pure Owner Owner Pure Pure Owner Owner Pure
Owner Tenant Owner Tenant
Tenant in Tenant Tenant in Tenant
Op. out Op. out
(1) (2) (3) (4) (5) (6) (7) (8)
Farmer 9.8 4.9 28.2 4.3 21.4 11.6 30.0 2.8
Farmer – Farm Laborer 26.7 20.5 7.7 31.1 19.6 19.8 3.3 30.6
Farmer – Farm Laborer –
24.6 27.5 9.9 40.6 22.3 26.7 3.3 50.0
non- agriculture
Farmer – non Agriculture 38.9 46.5 52.2 24.0 36.6 41.9 63.3 16.6
100 100 100 100 100 100 100 100
2)
Other (N=) (4) (1) - - - - (1) -
All Households (N=) (459) (143) (71) (141) (112) (86) (32) (36)
269