
Page 337 - Ranah Studi Agraria: Penguasaan Tanah dan Hubungan Agraris
P. 337
Ranah Studi Agraria
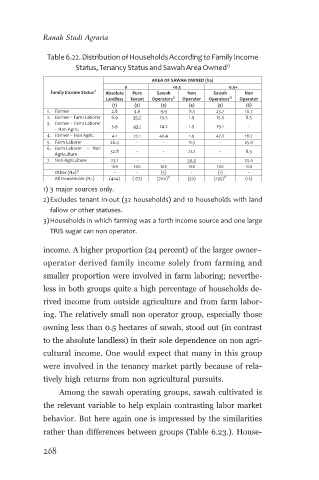
Table 6.22. Distribution of Households According to Family Income
Status, Tenancy Status and Sawah Area Owned 1)
AREA OF SAWAH OWNED (ha)
0 <0.5 0.5+
Family Income Status 1) Absolute Pure Sawah Non Sawah Non
Landless Tenant Operators 2) Operator Operators 2) Operator
(1) (2) (3) (4) (5) (6)
1. Farmer 2.8 4.0 9.9 11.5 23.7 16.7
2. Farmer – Farm Laborer 6.9 30.7 23.5 1.9 15.5 8.3
3. Farmer – Farm Laborer 3.9 43.1 24.2 1.9 19.1 -
– Non Agric.
4. Farmer – Non Agric. 4.1 22.1 42.4 1.9 47.7 16.7
5. Farm Laborer 26.4 - - 11.5 - 25.0
6. Farm Laborer – Non 32.8 - - 21.2 - 8.3
Agriculture
7. Non Agriculture 23.1 - - 50.0 - 25.0
100 100 100 100 100 100
3)
Other (N=) - - (5) - (1) -
All Households (N=) (404) (177) (700) 2) (52) (195) 2) (12)
1) 3 major sources only.
2)Excludes tenant in-out (32 households) and 10 households with land
fallow or other statuses.
3)Households in which farming was a forth income source and one large
TRIS sugar can non operator.
income. A higher proportion (24 percent) of the larger owner–
operator derived family income solely from farming and
smaller proportion were involved in farm laboring; neverthe-
less in both groups quite a high percentage of households de-
rived income from outside agriculture and from farm labor-
ing. The relatively small non operator group, especially those
owning less than 0.5 hectares of sawah, stood out (in contrast
to the absolute landless) in their sole dependence on non agri-
cultural income. One would expect that many in this group
were involved in the tenancy market partly because of rela-
tively high returns from non agricultural pursuits.
Among the sawah operating groups, sawah cultivated is
the relevant variable to help explain contrasting labor market
behavior. But here again one is impressed by the similarities
rather than differences between groups (Table 6.23.). House-
268