
Page 496 - Microeconomics, Fourth Edition
P. 496
c11monopolyandmonopsony.qxd 7/14/10 7:58 PM Page 470
470 CHAPTER 11 MONOPOLY AND MONOPSONY
For example, as shown in Figure 11.16, if a perfectly competitive industry supplied
600 units, the supply curve would tell us the marginal cost of the 600th unit: $3.
When the industry is monopolized, the supply curve S now becomes the monopo-
list’s marginal cost curve, MC. Given this, the profit-maximizing monopoly equilib-
rium occurs where MR MC, at a quantity of 600 units and price of $9 per unit.
We can see from Figure 11.16 how the monopoly equilibrium (point J ) and the
competitive equilibrium (point K ) differ: The monopoly price is higher than the
perfectly competitive price, and the monopolist supplies less output than the per-
fectly competitive industry does.
APPLICA TION 11.7
The Deadweight Loss in the the welfare costs of both monopoly and cartel. Note
that these estimates will understate the deadweight
Norwegian Cement Industry loss because Cournot competition itself involves some
inefficiency as well.
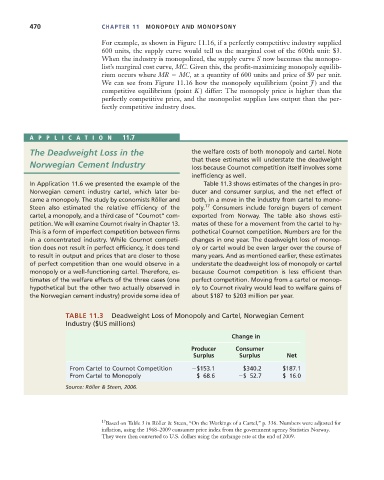
In Application 11.6 we presented the example of the Table 11.3 shows estimates of the changes in pro-
Norwegian cement industry cartel, which later be- ducer and consumer surplus, and the net effect of
came a monopoly. The study by economists Röller and both, in a move in the industry from cartel to mono-
Steen also estimated the relative efficiency of the poly. 17 Consumers include foreign buyers of cement
cartel, a monopoly, and a third case of “Cournot” com- exported from Norway. The table also shows esti-
petition. We will examine Cournot rivalry in Chapter 13. mates of these for a movement from the cartel to hy-
This is a form of imperfect competition between firms pothetical Cournot competition. Numbers are for the
in a concentrated industry. While Cournot competi- changes in one year. The deadweight loss of monop-
tion does not result in perfect efficiency, it does tend oly or cartel would be even larger over the course of
to result in output and prices that are closer to those many years. And as mentioned earlier, these estimates
of perfect competition than one would observe in a understate the deadweight loss of monopoly or cartel
monopoly or a well-functioning cartel. Therefore, es- because Cournot competition is less efficient than
timates of the welfare effects of the three cases (one perfect competition. Moving from a cartel or monop-
hypothetical but the other two actually observed in oly to Cournot rivalry would lead to welfare gains of
the Norwegian cement industry) provide some idea of about $187 to $203 million per year.
TABLE 11.3 Deadweight Loss of Monopoly and Cartel, Norwegian Cement
Industry ($US millions)
Change in
Producer Consumer
Surplus Surplus Net
From Cartel to Cournot Competition $153.1 $340.2 $187.1
From Cartel to Monopoly $ 68.6 $ 52.7 $ 16.0
Source: Röller & Steen, 2006.
17 Based on Table 3 in Röller & Steen, “On the Workings of a Cartel,” p. 336. Numbers were adjusted for
inflation, using the 1968–2009 consumer price index from the government agency Statistics Norway.
They were then converted to U.S. dollars using the exchange rate at the end of 2009.