
Page 498 - Microeconomics, Fourth Edition
P. 498
c11monopolyandmonopsony.qxd 7/14/10 7:58 PM Page 472
472 CHAPTER 11 MONOPOLY AND MONOPSONY
NATURAL MONOPOLY
natural monopoly A A market is a natural monopoly if, for any relevant level of industry output, the total
market in which, for any cost a single firm producing that output would incur is less than the combined total
relevant level of industry cost that two or more firms would incur if they divided that output among them. A
output, the total cost in- good example of a natural monopoly is satellite television broadcasting. If, for exam-
curred by a single firm pro- ple, two firms split a market consisting of 50 million subscribers, each must incur the
ducing that output is less
than the combined total cost of buying, launching, and maintaining a satellite to provide service to its 25 mil-
cost that two or more lion subscribers. But if a single firm serves the entire market, the satellite that served
firms would incur if they 25 million subscribers can just as well serve 50 million subscribers. That is, the cost of
divided that output among the satellite is fixed: It does not go up as the number of subscribers goes up. A single
themselves. firm needs just one satellite to serve the market, while two independent firms would
need two satellites to serve the same number of subscribers overall.
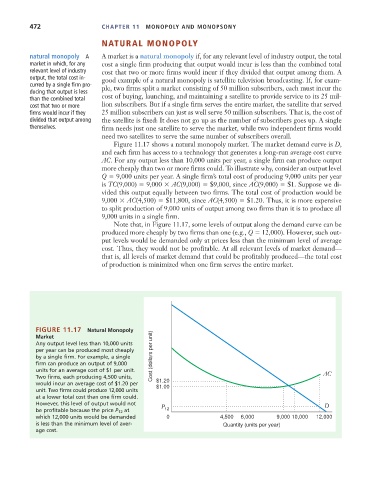
Figure 11.17 shows a natural monopoly market. The market demand curve is D,
and each firm has access to a technology that generates a long-run average cost curve
AC. For any output less than 10,000 units per year, a single firm can produce output
more cheaply than two or more firms could. To illustrate why, consider an output level
Q 9,000 units per year. A single firm’s total cost of producing 9,000 units per year
is TC(9,000) 9,000 AC(9,000) $9,000, since AC(9,000) $1. Suppose we di-
vided this output equally between two firms. The total cost of production would be
9,000 AC(4,500) $11,800, since AC(4,500) $1.20. Thus, it is more expensive
to split production of 9,000 units of output among two firms than it is to produce all
9,000 units in a single firm.
Note that, in Figure 11.17, some levels of output along the demand curve can be
produced more cheaply by two firms than one (e.g., Q 12,000). However, such out-
put levels would be demanded only at prices less than the minimum level of average
cost. Thus, they would not be profitable. At all relevant levels of market demand—
that is, all levels of market demand that could be profitably produced—the total cost
of production is minimized when one firm serves the entire market.
FIGURE 11.17 Natural Monopoly
Market
Any output level less than 10,000 units
per year can be produced most cheaply
by a single firm. For example, a single Cost (dollars per unit)
firm can produce an output of 9,000
units for an average cost of $1 per unit. AC
Two firms, each producing 4,500 units,
would incur an average cost of $1.20 per $1.20
$1.00
unit. Two firms could produce 12,000 units
at a lower total cost than one firm could.
However, this level of output would not P D
be profitable because the price P 12 at 12
which 12,000 units would be demanded 0 4,500 6,000 9,000 10,000 12,000
is less than the minimum level of aver- Quantity (units per year)
age cost.