
Page 493 - Microeconomics, Fourth Edition
P. 493
c11monopolyandmonopsony.qxd 7/14/10 7:58 PM Page 467
11.4 MONOPOLY WITH MULTIPLE PLANTS AND MARKETS 467
in allocating output across its individual plants. Thus, the conditions for profit maxi-
mization by a cartel are identical to those for a multiplant monopolist. To illustrate,
suppose a cartel consists of two firms, with marginal cost functions MC 1 (Q ) and
1
MC (Q ). At the profit-maximizing solution, the cartel allocates production between
2
2
the two firms so that marginal costs are equal and the common marginal cost equals
the industrywide marginal revenue. Mathematically, letting Q* be the optimal total
output for the cartel as a whole, and letting Q* and Q* be the optimal outputs of the
2
1
individual cartel members, we can express the profit-maximization condition of the
cartel as follows: 14
MR(Q*) MC (Q*)
1
1
MR(Q*) MC (Q*)
2
2
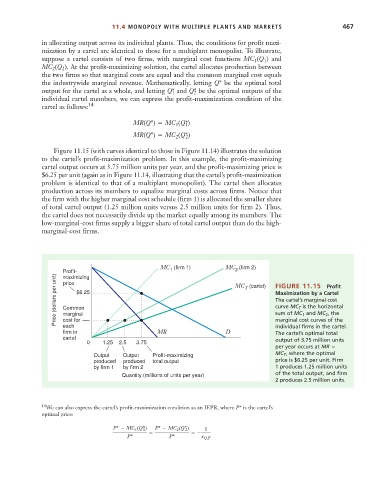
Figure 11.15 (with curves identical to those in Figure 11.14) illustrates the solution
to the cartel’s profit-maximization problem. In this example, the profit-maximizing
cartel output occurs at 3.75 million units per year, and the profit-maximizing price is
$6.25 per unit (again as in Figure 11.14, illustrating that the cartel’s profit-maximization
problem is identical to that of a multiplant monopolist). The cartel then allocates
production across its members to equalize marginal costs across firms. Notice that
the firm with the higher marginal cost schedule (firm 1) is allocated the smaller share
of total cartel output (1.25 million units versus 2.5 million units for firm 2). Thus,
the cartel does not necessarily divide up the market equally among its members: The
low-marginal-cost firms supply a bigger share of total cartel output than do the high-
marginal-cost firms.
MC (firm 1) MC (firm 2)
Profit- 1 2
Price (dollars per unit) Common MC (cartel) FIGURE 11.15 Profit
maximizing
price
T
$6.25
Maximization by a Cartel
The cartel’s marginal cost
curve MC T is the horizontal
sum of MC 1 and MC 2 , the
marginal
cost for
individual firms in the cartel.
each
firm in MR D marginal cost curves of the
The cartel’s optimal total
cartel output of 3.75 million units
0 1.25 2.5 3.75
per year occurs at MR
MC T , where the optimal
Output Output Profit-maximizing
produced produced total output price is $6.25 per unit. Firm
by firm 1 by firm 2 1 produces 1.25 million units
of the total output, and firm
Quantity (millions of units per year)
2 produces 2.5 million units.
14 We can also express the cartel’s profit-maximization condition as an IEPR, where P* is the cartel’s
optimal price:
P* MC 1 (Q* 1 ) P* MC 2 (Q* 2 ) 1
P* P* Q,P