
Page 488 - Microeconomics, Fourth Edition
P. 488
c11monopolyandmonopsony.qxd 7/14/10 7:58 PM Page 462
462 CHAPTER 11 MONOPOLY AND MONOPSONY
$27
Total Revenue (millions of dollars per year) $32 Marginal Marginal
revenue
revenue
is negative
is positive
0 3 4 TR
Quantity (millions of ounces per year)
(a)
MC
1 MC
0
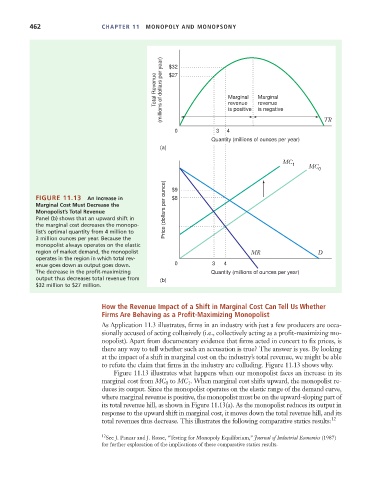
FIGURE 11.13 An Increase in $9
$8
Marginal Cost Must Decrease the
Monopolist’s Total Revenue Price (dollars per ounce)
Panel (b) shows that an upward shift in
the marginal cost decreases the monopo-
list’s optimal quantity from 4 million to
3 million ounces per year. Because the
monopolist always operates on the elastic
region of market demand, the monopolist MR D
operates in the region in which total rev-
enue goes down as output goes down. 0 3 4
The decrease in the profit-maximizing Quantity (millions of ounces per year)
output thus decreases total revenue from (b)
$32 million to $27 million.
How the Revenue Impact of a Shift in Marginal Cost Can Tell Us Whether
Firms Are Behaving as a Profit-Maximizing Monopolist
As Application 11.3 illustrates, firms in an industry with just a few producers are occa-
sionally accused of acting collusively (i.e., collectively acting as a profit-maximizing mo-
nopolist). Apart from documentary evidence that firms acted in concert to fix prices, is
there any way to tell whether such an accusation is true? The answer is yes. By looking
at the impact of a shift in marginal cost on the industry’s total revenue, we might be able
to refute the claim that firms in the industry are colluding. Figure 11.13 shows why.
Figure 11.13 illustrates what happens when our monopolist faces an increase in its
marginal cost from MC 0 to MC 1 . When marginal cost shifts upward, the monopolist re-
duces its output. Since the monopolist operates on the elastic range of the demand curve,
where marginal revenue is positive, the monopolist must be on the upward-sloping part of
its total revenue hill, as shown in Figure 11.13(a). As the monopolist reduces its output in
response to the upward shift in marginal cost, it moves down the total revenue hill, and its
total revenues thus decrease. This illustrates the following comparative statics results: 12
12 See J. Panzar and J. Rosse, “Testing for Monopoly Equilibrium,” Journal of Industrial Economics (1987)
for further exploration of the implications of these comparative statics results.