
Page 484 - Microeconomics, Fourth Edition
P. 484
c11monopolyandmonopsony.qxd 7/14/10 7:58 PM Page 458
458 CHAPTER 11 MONOPOLY AND MONOPSONY
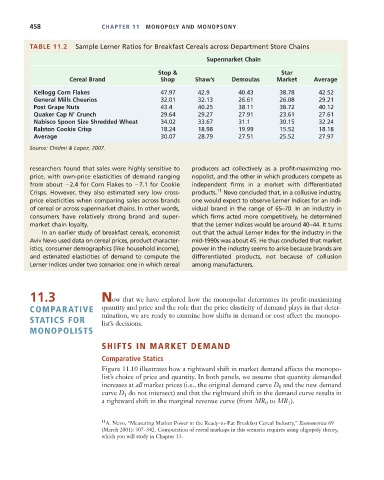
TABLE 11.2 Sample Lerner Ratios for Breakfast Cereals across Department Store Chains
Supermarket Chain
Stop & Star
Cereal Brand Shop Shaw’s Demoulas Market Average
Kellogg Corn Flakes 47.97 42.9 40.43 38.78 42.52
General Mills Cheerios 32.01 32.13 26.61 26.08 29.21
Post Grape Nuts 43.4 40.25 38.11 38.72 40.12
Quaker Cap N’ Crunch 29.64 29.27 27.91 23.61 27.61
Nabisco Spoon Size Shredded Wheat 34.02 33.67 31.1 30.15 32.24
Ralston Cookie Crisp 18.24 18.98 19.99 15.52 18.18
Average 30.07 28.79 27.51 25.52 27.97
Source: Chidmi & Lopez, 2007.
researchers found that sales were highly sensitive to producers act collectively as a profit-maximizing mo-
price, with own-price elasticities of demand ranging nopolist, and the other in which producers compete as
from about 2.4 for Corn Flakes to 7.1 for Cookie independent firms in a market with differentiated
Crisps. However, they also estimated very low cross- products. 11 Nevo concluded that, in a collusive industry,
price elasticities when comparing sales across brands one would expect to observe Lerner Indices for an indi-
of cereal or across supermarket chains. In other words, vidual brand in the range of 65–70. In an industry in
consumers have relatively strong brand and super- which firms acted more competitively, he determined
market chain loyalty. that the Lerner Indices would be around 40–44. It turns
In an earlier study of breakfast cereals, economist out that the actual Lerner Index for the industry in the
Aviv Nevo used data on cereal prices, product character- mid-1990s was about 45. He thus concluded that market
istics, consumer demographics (like household income), power in the industry seems to arise because brands are
and estimated elasticities of demand to compute the differentiated products, not because of collusion
Lerner Indices under two scenarios: one in which cereal among manufacturers.
11.3 Now that we have explored how the monopolist determines its profit-maximizing
COMPARATIVE quantity and price and the role that the price elasticity of demand plays in that deter-
mination, we are ready to examine how shifts in demand or cost affect the monopo-
STATICS FOR list’s decisions.
MONOPOLISTS
SHIFTS IN MARKET DEMAND
Comparative Statics
Figure 11.10 illustrates how a rightward shift in market demand affects the monopo-
list’s choice of price and quantity. In both panels, we assume that quantity demanded
increases at all market prices (i.e., the original demand curve D and the new demand
0
curve D do not intersect) and that the rightward shift in the demand curve results in
1
a rightward shift in the marginal revenue curve (from MR to MR ).
0
1
11 A. Nevo, “Measuring Market Power in the Ready-to-Eat Breakfast Cereal Industry,” Econometrica 69
(March 2001): 307–342. Computation of cereal markups in this scenario requires using oligopoly theory,
which you will study in Chapter 13.