
Page 487 - Microeconomics, Fourth Edition
P. 487
c11monopolyandmonopsony.qxd 7/14/10 7:58 PM Page 461
11.3 COMPARATIVE STATICS FOR MONOPOLISTS 461
APPLICA TION 11.4
Parking Meter Pricing in Chicago nopolist. However, the convenience of driving one’s
car and parking right on the street means that CPM
In 2009 the city of Chicago outsourced its parking faces a downward-sloping demand curve. It is reason-
meters, selling the rights to install, operate, and collect able to assume that the marginal cost of operating
the profits from the meters to the private firm an additional parking meter is approximately the
Chicago Parking Meters (CPM). Meter rates were sub- same in each neighborhood. However, the demand
stantially increased throughout the city, to great curve for parking in the Loop probably lies above and
protest from citizens. As of January 2010, the meter to the right of the demand curve for parking in other
rate was $4.50 per hour in the Loop business district. parts of Chicago. This is because of congestion and
In other busy downtown neighborhoods the rate was because more drivers have urgent business and so are
$2.50 per hour, while in less busy areas it was $1.25. willing to pay more for the convenience of street
The monopoly midpoint rule shows why it might parking. Given all of this, the monopoly midpoint
make sense for CPM to increase the price in busy rule implies that CPM can increase its profits by
areas. Since drivers can park in garages or take cabs charging higher prices in the Loop, and lower prices
or public transportation, the company is not a mo- in less busy neighborhoods.
SHIFTS IN MARGINAL COST
Comparative Statics
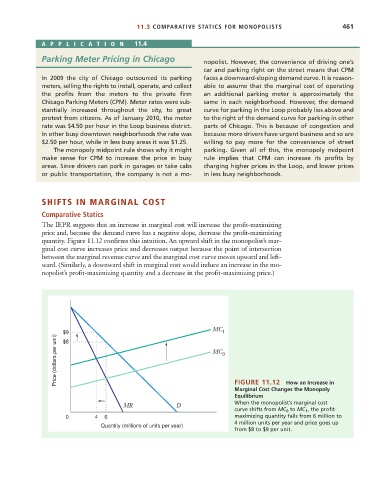
The IEPR suggests that an increase in marginal cost will increase the profit-maximizing
price and, because the demand curve has a negative slope, decrease the profit-maximizing
quantity. Figure 11.12 confirms this intuition. An upward shift in the monopolist’s mar-
ginal cost curve increases price and decreases output because the point of intersection
between the marginal revenue curve and the marginal cost curve moves upward and left-
ward. (Similarly, a downward shift in marginal cost would induce an increase in the mo-
nopolist’s profit-maximizing quantity and a decrease in the profit-maximizing price.)
MC
$9 1
Price (dollars per unit) MC 0
$8
FIGURE 11.12
How an Increase in
Marginal Cost Changes the Monopoly
Equilibrium
MR D When the monopolist’s marginal cost
curve shifts from MC 0 to MC 1 , the profit-
0 4 6 maximizing quantity falls from 6 million to
4 million units per year and price goes up
Quantity (millions of units per year)
from $8 to $9 per unit.