
Page 485 - Microeconomics, Fourth Edition
P. 485
c11monopolyandmonopsony.qxd 7/21/10 9:13 AM Page 459
11.3 COMPARATIVE STATICS FOR MONOPOLISTS 459
MC $13
Price (dollars per unit) $10 Price (dollars per unit) $10
$12
$9
MR MR D D 1 MR MC D D 1
0 1 0 0 0
0 2 3 0 2 6 MR
1
Quantity (millions of units per year) Quantity (millions of units per year)
(a) (b)
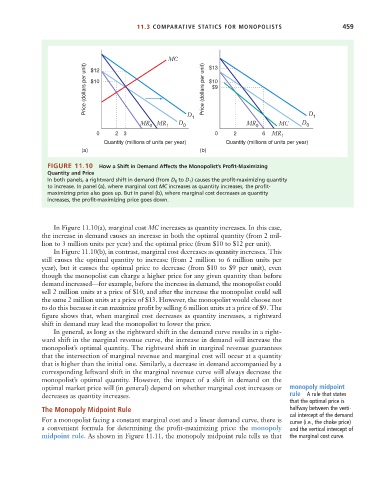
FIGURE 11.10 How a Shift in Demand Affects the Monopolist’s Profit-Maximizing
Quantity and Price
In both panels, a rightward shift in demand (from D 0 to D 1 ) causes the profit-maximizing quantity
to increase. In panel (a), where marginal cost MC increases as quantity increases, the profit-
maximizing price also goes up. But in panel (b), where marginal cost decreases as quantity
increases, the profit-maximizing price goes down.
In Figure 11.10(a), marginal cost MC increases as quantity increases. In this case,
the increase in demand causes an increase in both the optimal quantity (from 2 mil-
lion to 3 million units per year) and the optimal price (from $10 to $12 per unit).
In Figure 11.10(b), in contrast, marginal cost decreases as quantity increases. This
still causes the optimal quantity to increase (from 2 million to 6 million units per
year), but it causes the optimal price to decrease (from $10 to $9 per unit), even
though the monopolist can charge a higher price for any given quantity than before
demand increased—for example, before the increase in demand, the monopolist could
sell 2 million units at a price of $10, and after the increase the monopolist could sell
the same 2 million units at a price of $13. However, the monopolist would choose not
to do this because it can maximize profit by selling 6 million units at a price of $9. The
figure shows that, when marginal cost decreases as quantity increases, a rightward
shift in demand may lead the monopolist to lower the price.
In general, as long as the rightward shift in the demand curve results in a right-
ward shift in the marginal revenue curve, the increase in demand will increase the
monopolist’s optimal quantity. The rightward shift in marginal revenue guarantees
that the intersection of marginal revenue and marginal cost will occur at a quantity
that is higher than the initial one. Similarly, a decrease in demand accompanied by a
corresponding leftward shift in the marginal revenue curve will always decrease the
monopolist’s optimal quantity. However, the impact of a shift in demand on the
optimal market price will (in general) depend on whether marginal cost increases or monopoly midpoint
decreases as quantity increases. rule A rule that states
that the optimal price is
The Monopoly Midpoint Rule halfway between the verti-
cal intercept of the demand
For a monopolist facing a constant marginal cost and a linear demand curve, there is curve (i.e., the choke price)
a convenient formula for determining the profit-maximizing price: the monopoly and the vertical intercept of
midpoint rule. As shown in Figure 11.11, the monopoly midpoint rule tells us that the marginal cost curve.